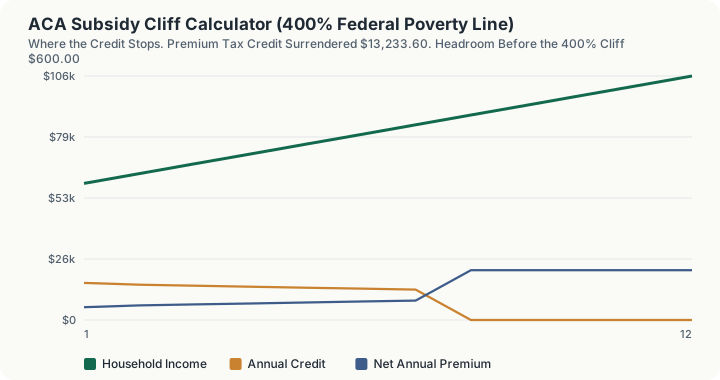
Quick Answer: An extra $1,000 of income, taken by a two-person household already at $84,000 of MAGI, costs 1,323.36% of itself. It surrenders $13,233.60 of premium tax credit, because $84,000 sits at 397.2% of the federal poverty line and $85,000 sits at 401.9%, past the 400% ceiling where the 2026 credit stops entirely.
What does this calculator do?
The premium tax credit under Internal Revenue Code section 36B is usually described as a sliding scale, and for most of its range that description is right. Between 0% and 400% of the federal poverty line, the share of income a household is expected to contribute toward the benchmark plan rises smoothly from 2.10% to 9.96%, and each extra dollar of income costs a few cents of credit.
At 400% of the poverty line the description stops being right. For 2026 there is no band above 400%. IRS Rev. Proc. 2025-25 tops the Applicable Percentage Table out at "At least 300% but not more than 400%", and the American Rescue Plan and Inflation Reduction Act extension that had removed the ceiling and capped contributions at 8.5% of income expired for taxable years after 2025. The statutory cliff is therefore in force for the 2026 coverage year. A household one dollar over the line does not lose a few cents of credit. It loses the entire remaining annual credit.
That makes the marginal cost of the last dollar of income near the line enormous, and it is invisible to anyone modelling the credit as a taper. This calculator computes the credit at your income and again at your income plus the extra amount, and divides the credit surrendered by the extra income. The result is a ratio, expressed as a percentage of the extra income, and near the cliff it routinely exceeds 100% by an order of magnitude.
The extra income in question is usually deliberate and usually optional: a Roth conversion, a capital gain harvested for tax reasons, a consulting invoice sent in December rather than January. Those are exactly the decisions where knowing the true marginal cost changes the answer.
How is this calculated?
The credit itself is benchmark premium less an expected contribution, floored at zero and capped by the premium of the plan you actually buy:
Credit = min(Chosen Premium, max(0, Benchmark Premium − MAGI × a))
where $a$ is the applicable percentage read from the 2026 table and linearly interpolated within its band. The marginal cost of extra income is then:
Marginal Cost % = (Credit (MAGI) − Credit (MAGI + Extra))/Extra × 100
Step 1: Find the federal poverty line for the household. The engine uses the 2025 HHS guidelines, which are the guidelines the Marketplace applies to the 2026 coverage year. For the 48 contiguous states, the line is the first-person figure plus a constant increment for each additional person: $15,650 + (2 - 1) x $5,500 = $21,150
Step 2: Express income as a percentage of that line. $84,000 / $21,150 = 3.97163 = 397.2% of the poverty line
Step 3: Read the applicable percentage for that band. 397.2% falls in the 300%-400% band, whose initial and final percentages are both 9.96%, so the interpolation is flat across it: 9.96%
Step 4: Compute the expected contribution. $84,000 x 9.96% = $8,366.40 a year
Step 5: Compute the credit as benchmark less expected contribution. $1,800 x 12 = $21,600 benchmark annual premium $21,600 - $8,366.40 = $13,233.60 of annual credit
Step 6: Recompute everything at the higher income. $85,000 / $21,150 = 401.9% of the poverty line, which is above 400%, so no applicable percentage exists and the credit is $0
Step 7: Divide the credit surrendered by the extra income. $13,233.60 - $0 = $13,233.60 surrendered $13,233.60 / $1,000 = 13.2336 = 1,323.36%
The calculator also reports the income that sits exactly on the line, $21,150 x 400% = $84,600, and the headroom from your current income to it, here $600.
Worked Example
Take the same household and price a $1,000 Roth conversion done in December.
Step 1: Net premium before the conversion. $21,600 - $13,233.60 = $8,366.40 a year, or $697.20 a month
Step 2: Net premium after the conversion. With no credit, the household pays the full chosen premium: $1,800.00 a month
Step 3: Annual premium increase. $1,800.00 - $697.20 = $1,102.80 a month $1,102.80 x 12 = $13,233.60 more premium for the year
Step 4: Compare against the income that caused it. $13,233.60 of extra cost against $1,000 of extra income leaves the household $12,233.60 worse off, before a cent of income tax is calculated on the conversion.
Step 5: Contrast with the same $1,000 well inside the taper. At $60,000 of MAGI the household sits at 283.7% of the poverty line, inside the 250%-300% band, where the applicable percentage rises with income rather than stopping. The same $1,000 costs only the sliding-scale share of the credit, a few tens of dollars rather than the whole thing.
The table on this page walks household income across a range spanning the cliff at one-twentieth-of-the-cliff steps, so the step down is visible rather than described. It is a step, not a slope, and that is the entire point of the page.
What does this calculator not account for?
- Income tax on the extra income. The marginal cost shown here is credit surrendered only. A $1,000 Roth conversion at a 22% federal rate costs another $220 on top, and state income tax on top of that.
- State-level subsidy programmes. Several states run their own premium assistance above 400% of the poverty line. None is modelled; the calculation is federal only.
- Cost-sharing reductions. Silver-plan deductible and out-of-pocket reductions, available under 250% of the poverty line, are a separate benefit and are not computed here.
- The repayment limitation on advance credits. If you took advance payments during the year and end over the line, section 36B(f)(2)(B) caps repayment for some households. No cap is applied here; the full credit is treated as surrendered.
- Employer coverage affordability. The 9.96% Required Contribution Percentage governs whether an employer offer blocks eligibility. That test is not run.
- Medicaid eligibility at the bottom of the range, which in expansion states replaces the credit entirely below 138% of the poverty line.
- Household size changes, mid-year enrolment, or partial-year coverage. The calculation is a full twelve months at one household size.
What mistakes do people make with this?
- Using the premium of the plan you bought instead of the benchmark. The credit is set from the second-lowest-cost silver plan for your household and ZIP code, whatever you actually enrol in. Entering your own premium as the benchmark misstates the credit in both directions.
- Assuming the cliff was permanently repealed. It was suspended for 2021 through 2025 and returned for 2026. Advice written during the suspension is now wrong.
- Forgetting that MAGI for this purpose includes tax-exempt interest and excluded foreign earned income, which the ordinary AGI line does not.
- Treating a small headroom figure as safe. Here the headroom is $600. A single freelance invoice, a mutual fund capital gain distribution, or an unplanned retirement account distribution clears it.
- Managing the December conversion but not the January one. The credit is computed on the full tax year. Deferring income into the next year moves the problem rather than solving it, unless the next year's income is genuinely lower.
- Reading the ratio as a tax rate. 1,323.36% is credit lost per dollar of extra income. It is not a marginal tax rate, and adding it to one would double-count nothing but would still be the wrong quantity.
Frequently Asked Questions
Is the ACA subsidy cliff back for 2026?
What income puts a household of two over the cliff in 2026?
Why is the marginal cost more than 100%?
Does buying a cheaper plan reduce the damage?
Can I get back under the line after the year has ended?
Does this tell me whether to do the Roth conversion?
Sources
- IRS Revenue Procedure 2025-25, section 3.01 (Applicable Percentage Table for taxable years beginning in calendar year 2026) and section 3.02 (Required Contribution Percentage, 9.96%): irs.gov/pub/irs-drop/rp-25-25.pdf
- 2025 HHS Poverty Guidelines, the guidelines the Marketplace applies to the 2026 coverage year: aspe.hhs.gov/sites/default/files/documents/dd73d4f00d8a819d10b2fdb70d254f7b/detailed-guidelines-2025.pdf
- The statutory framework is Internal Revenue Code section 36B, whose subsection (b)(3)(A)(i) directs that the applicable percentage increase "on a sliding scale in a linear manner" across each band, which is the interpolation this engine performs. law.cornell.edu/uscode/text/26/36B
Also consulted: Both are held in this project as engine/tables/2026/aca-ptc.json, verified 2026-08-30.