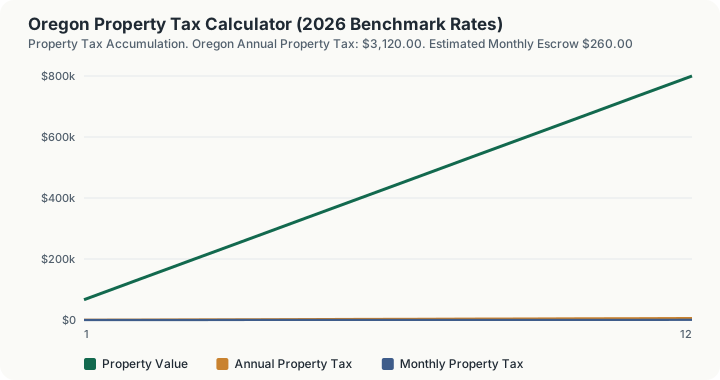
Quick Answer: A $400,000 home in Oregon carries an estimated $3,120.00 in annual property tax at the state's 0.78% effective rate, or about $260.00 a month.
Where Assessed Value And Market Value Diverge By Statute
Oregon's average effective property tax rate of 0.78% works out to a #25 national ranking, just above the national median. Nationally, the average effective rate runs close to 1.0%, which puts Oregon close to the national average of roughly 1.0%. That's above the West regional average of about 0.71%.
Oregon's Measure 50, adopted in 1997, decoupled taxable value from market value and limits how fast assessed value can grow each year. That shapes what a given assessed value actually turns into on the tax bill over the years you own the property, not just in year one.
Oregon counties handle the mechanics of periodic reappraisal and millage-setting locally, so the statewide average above is a useful benchmark but actual bills still hinge on the specific county, school district, and any exemptions or appeals the owner has filed in a given year.
How This Is Calculated
Oregon severed assessed value from market value in 1997. Measure 50 set each property's assessed value from its 1995 value and lets it grow only 3% a year, and the tax applies to the lesser of that figure or real market value. Measure 5 then caps the combined rate at $10 per $1,000 for general government and $5 for schools.
None of that detail is asked for here. This calculator works one level up, applying Oregon's average effective property tax rate of 0.78% to the value you enter. That rate is the ratio of property taxes actually paid to home value across the state, so the assessment ratios, caps, and exemptions described above are already baked into it.
Working through it in order:
- Start from maximum assessed value. That is the Measure 50 figure, which in most of Oregon sits far below what the home would sell for.
- Compare and apply limits. Tax applies to the lower of maximum assessed value or real market value, and Measure 5 compression cuts rates that breach the caps.
- Multiply by the effective rate. At 0.78%, a $400,000 home in Oregon comes to $3,120 a year before any exemption you enter above.
- Divide by twelve for escrow. That same home works out to $260.00 a month set aside in a mortgage escrow account.
- Compare it against your own bill. Two neighbors in Oregon can pay very different taxes on identical houses purely because of what their 1995 values were. Your county's number is the one that governs; this figure tells you whether it is roughly where an Oregon home of that value ought to land.
Worked Example
Using this calculator's baseline inputs: a $400,000 home in Oregon, taxed at the state's 0.78% average effective rate (rank #25 of 50 states).
- Start with the assessed value. The home is assessed at its full $400,000.00 market value, with no homestead exemption applied in this baseline scenario.
- Apply the effective rate. $400,000.00 × 0.78% = $3,120.00 in annual property tax, Oregon's statewide average effective rate.
- Convert to a monthly escrow. Lenders typically collect property tax in twelve equal installments alongside principal and interest: $3,120.00 ÷ 12 = $260.00 per month.
- Project a five-year hold. At a flat rate, five years of ownership totals $3,120.00 × 5 = $15,600.00, before any reassessment, exemption change, or millage increase.
At 0.78%, Oregon lands roughly in the middle nationally, ranking #25 of 50 states. That is a moderate but still material carrying cost for homeowners.
Where The Oregon Sweep Stops Being Reliable
Oregon's 0.78% is applied as one statewide effective rate against whatever value you type, which is the single most important thing to understand about this page before reading any figure on it.
What $10,000 more of entered value costs. Raising the assessed value from $400,000 to $410,000 moves the annual tax from $3,120.00 to $3,198.00. Every additional $10,000 of Oregon valuation costs exactly $78.00 a year, at every value the calculator accepts. Doubling the value to $800,000 doubles the tax to $6,240.00 to the cent.
The tier table, top to bottom. The table steps the value in increments of $66,666.67, from $66,666.67 in row one to $800,000 in row twelve, and the tax column rises by exactly $520.00 on every row without a single break. Row six carries the $3,120.00 baseline; row twelve carries $6,240.00, which is precisely double it.
Solving for the value that produces a given bill. Divide by 0.0078. A $10,000 annual bill corresponds to $1,282,051.28 of assessed value, and the $400,000 baseline is the value that produces the $260.00 monthly escrow line. Because the relationship is exactly linear with no cap, no cliff and no minimum, there is no valuation at which the arithmetic bends.
The exemption input and the table, now in agreement. Entering a $25,000 exemption reduces the taxable assessed value to $375,000 and the annual tax to $2,925.00, a saving of $195.00 a year against the $3,120.00 the page returns with the field at zero. That reduction reaches the headline, the monthly escrow figure and the twelve-row schedule alike. With $25,000 entered, row six prices $400,000 of value at $2,925.00, the same figure as the headline, and row one falls from $520.00 to $325.00. Because every row nets the same exemption off before applying the 0.78% rate, the table can be read straight across against the result above it rather than being treated as a separate gross-value answer.
Escrow draws run above the computed monthly line. The escrow figure is where the common error lives. The monthly line the engine reports is $260.00, being $3,120.00 divided by twelve. Lenders frequently collect a cushion of up to two months on top, so a servicer's actual monthly draw on this property can run above $260.00 without any of the tax figures on this page being wrong. Comparing a servicer's escrow line directly against $260.00 and concluding the assessment is wrong is the mistake this page most often provokes.
What the rate is standing in for, and why Oregon disperses more than most. Measure 50 froze Oregon's maximum assessed value at 1995 levels plus 3% annual growth, so assessed value and real market value have diverged for three decades. The 0.78% is an outcome ratio of taxes actually paid to home value, so that divergence is reflected in the statewide average, but the spread around it is wider in Oregon than almost anywhere: a home held since the 1990s and an identical one sold last year carry very different maximum assessed values and therefore very different real bills, while this page returns $3,120.00 for both. The engine holds no maximum assessed value calculation and no 3% growth cap anywhere in the code, so it cannot separate them.
What This Does Not Account For
- Specific hyper-local county and municipal millage district variations within Oregon.
- Local Improvement District (LID) assessments. Oregon cities can form LIDs to bill an additional assessment to benefiting parcels for sewer, water, sidewalk, or street improvements, layered on top of the base millage captured in this calculator's statewide average.
- Commercial vs residential assessment classification differentials.
- Property tax appeal reductions or localized board of equalization adjustments.
Common Pitfalls
- Confusing Market Fair Value with Assessed Basis: Some jurisdictions assess property at fractional ratios rather than 100% of market value.
- Failing to File Homestead Paperwork: Homestead exemptions are rarely automatic; homeowners must file timely paperwork with the county appraisal district.
- Underestimating Post-Sale Supplemental Assessments: Purchasing a newly constructed or reassessed property often triggers catch-up supplemental tax bills.
- Ignoring Property Tax Appeal Windows: Missing the annual 30-to-60 day statutory protest window forfeits the right to challenge over-assessed property values for that tax year.
Frequently Asked Questions
How high are property taxes in Oregon?
When are property taxes due in Oregon?
How can I lower my property taxes in Oregon?
Does purchasing a home trigger a property tax reassessment?
Sources
- U.S. Census Bureau: American Community Survey (ACS) Real Estate Assessment Benchmark Data. census.gov/programs-surveys/acs
- Oregon Department of Revenue, Property Tax Division: Assessment Ratio Manuals. oregon.gov/dor