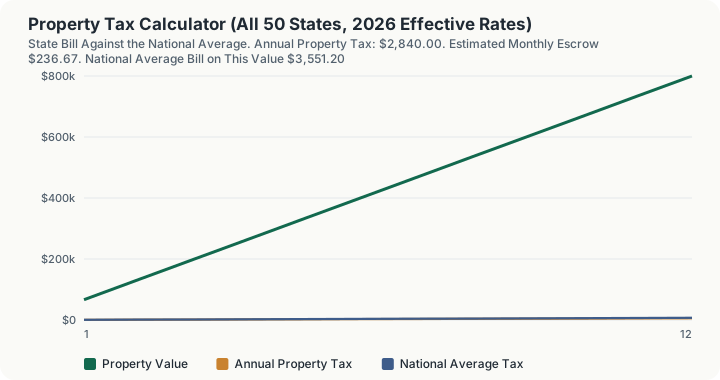
Quick Answer: A $400,000 home in California carries an estimated $2,840.00 in annual property tax at the state's 0.71% average effective rate, about $236.67 a month. That is $711.20 below the $3,551.20 the same home would average across all 50 states, and puts California 30th of 50 on this home value.
What does this calculator do?
Property tax is set by counties, cities, school districts and special districts, not by states. There is no single national rate, and any page that quotes one is quoting an average of averages. What does exist, and what is useful before you have a specific parcel in front of you, is each state's average effective rate: total property taxes actually paid divided by total home value across the state.
This page applies that rate for whichever state you pick, then runs the same home value through the other 49 so you can see where your state sits. The 50 state pages on this site answer "what does a home cost to hold in Ohio". This one answers "what does it cost here, and is that high or low".
Two numbers are worth reading together. The bill itself tells you what to budget. The rank and the gap against the national average tell you whether a purchase price that looks reasonable carries an unusual carrying cost. A $400,000 home in Illinois costs $7,680 a year to hold. The same home in Hawaii costs $1,080. Over a ten year hold that difference is $66,000, which is a material part of the purchase price itself.
How is this calculated?
The engine does three things, and only these three.
Taxable Value = max(0, Market Value − Exemption)
Annual Property Tax = Taxable Value × State Average Effective Rate
Monthly Escrow = (Annual Property Tax)/12
- Subtract the exemption you enter from the market value. The result floors at zero. Nothing else is deducted, and no exemption is applied for you: the field starts at $0 because eligibility is a county-level question this page cannot answer.
- Multiply by the selected state's average effective rate. For California that rate is 0.71%, so $400,000 becomes $2,840.00. The rate comes from
engine/tables/2026/state-property-tax.json, one figure per state. - Divide by twelve for the escrow line. $2,840.00 becomes $236.67 a month.
The national comparison repeats step 2 for all 50 states on the same taxable value, then sorts the results.
- Average across the 50 states. On a $400,000 home the mean bill is $3,551.20, which is the unweighted mean of the 50 state rates, 0.8878%, applied to your value. Unweighted matters: it treats Wyoming and Texas as one state each, so it runs lower than a value-weighted national figure would, because the high-rate states hold a disproportionate share of national home value.
- Rank the selected state. California lands 30th of 50 on this value. Rank 1 is the largest bill. Because every state's bill is a fixed percentage of the same value, the rank does not change as you change the home value, only the dollar gaps do.
- Report the gap. $2,840.00 against $3,551.20 is $711.20 below average, or 80.0% of the national average.
The schedule table below repeats the whole calculation at twelve home values, from one sixth of your entry up to twice it, with the national average beside each so the gap is visible across the price range rather than at a single point.
Worked Example
A buyer is looking at a $400,000 house in California and has no exemption filed.
- Taxable value. $400,000 minus $0 leaves $400,000.00.
- Apply the state rate. $400,000.00 x 0.71% = $2,840.00 for the year.
- Monthly escrow. $2,840.00 / 12 = $236.67, the line a lender adds to principal and interest.
- Compare nationally. The same house averages $3,551.20 across the 50 states. California is $711.20 cheaper to hold, at 80.0% of the national average, ranking 30th of 50.
- Test the other end of the range. Illinois, rank 1, would charge $7,680.00 on that house at 1.92%. Hawaii, rank 50, would charge $1,080.00 at 0.27%. The spread between the top and bottom state on one $400,000 house is $6,600 a year.
Now apply a $50,000 exemption in California. The taxable value drops to $350,000, the bill falls to $2,485.00, and the monthly escrow to $207.08. The exemption saved $355.00, which is the exemption amount times the same 0.71% rate. That is the general shape of exemption relief: it is worth the exemption times your effective rate, not the exemption itself.
What does this calculator not account for?
- Your actual millage. The state average is the ratio of taxes paid to home value statewide. Your county, city, school district and any special district set the real number, and within a single state the spread between two counties is routinely wider than the spread between two states.
- Assessment ratios and caps. Some states assess at a fraction of market value, some cap annual assessment growth, and California's Proposition 13 does both in a way that makes a long-held home's bill diverge sharply from a recent purchase. The average effective rate already reflects the aggregate result of those rules statewide, but it cannot reproduce them for your parcel.
- Exemptions you might qualify for. Homestead, senior, disability, veteran and agricultural relief all exist, all have filing deadlines, and none are applied here unless you enter a dollar amount.
- Non-residential classification. Commercial, industrial and vacant land are frequently assessed under different ratios or rates than owner-occupied housing.
- Special assessments. Charges for streets, sewers, sidewalks and improvement districts are levied on benefiting parcels on top of the general levy.
- Rate changes during your hold. The figure is a 2026 benchmark applied flat across the schedule table. Levies pass and reassessments happen.
What mistakes do people make with this?
- Reading the state average as your bill. It is a starting benchmark. Treat a county estimate that is 30% away from this figure as plausible, and one that is triple it as worth a phone call.
- Comparing a value-weighted average to this one. Published national property tax averages are often value-weighted and land near 1.0%. The 0.8878% used here is the unweighted mean of the 50 state rates. Both are correct; they answer different questions.
- Assuming a purchase resets nothing. In many states a sale triggers reassessment at the purchase price, so the seller's tax bill is a poor guide to yours. In a few, most notably California, that reassessment is the entire mechanism that makes new buyers pay more than long-tenured neighbours in identical houses.
- Forgetting the exemption is worth rate times value. A $50,000 exemption in a 0.27% state saves $135 a year. The same exemption in a 1.92% state saves $960.
- Escrow shortfalls after year one. Lenders set the initial escrow from an estimate, often the seller's old bill. When the reassessed bill arrives the shortfall is spread over the following twelve months on top of the higher payment.
Frequently Asked Questions
Which state has the highest property tax?
Which state has the lowest?
What is the average property tax in the United States?
Why does this differ from my county's estimate?
Does the rank change if I enter a different home value?
Sources
- U.S. Census Bureau, American Community Survey: median real estate taxes paid and median home value by state, the ratio underlying each state's average effective rate. census.gov/programs-surveys/acs
- Internal Revenue Service, the official authority for the tax rules this calculator relates to. irs.gov
Also consulted: State departments of revenue and county assessor offices: exemption eligibility, assessment ratios and appeal windows, none of which are modelled here.