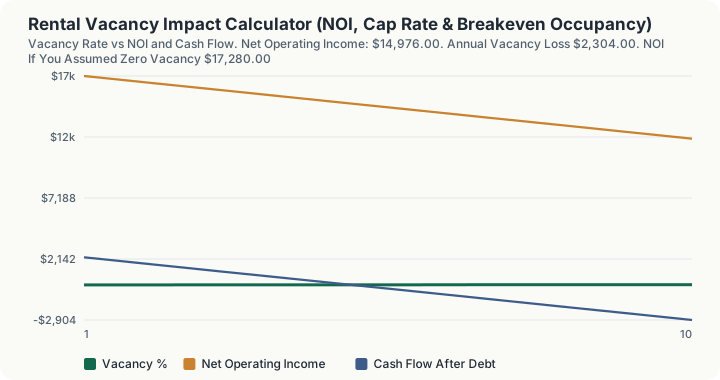
Quick Answer: A $300,000 rental at $2,400 a month with 8% vacancy and $11,520 of operating expenses produces $14,976.00 of net operating income and a 4.99% cap rate. Assume zero vacancy instead and the same property shows $17,280 and 5.76%. The deal needs 92.08% occupancy just to cover costs, and at 8% vacancy its cash flow is minus $24 a year.
What does this calculator do?
Vacancy is the assumption that quietly decides whether a rental works, and it is the one most often set to zero.
One month empty a year is 8.3% vacancy. Turnover is not a risk, it is a certainty: tenants move, units need cleaning and re-letting, and a property is rarely occupied every single day for years. Underwriting at 0% is not optimism, it is an error.
The gap it creates is large. Here, assuming no vacancy inflates NOI by $2,304 and the cap rate by 0.77 percentage points: enough to turn a marginal deal into an apparently good one.
Breakeven occupancy is the more honest test. At 92.08%, this property needs to be occupied all but one month a year to cover its operating costs and mortgage. That is a very thin margin.
How is this calculated?
Gross annual rent = Monthly rent × 12
Effective gross income = Gross rent × (1 − vacancy rate)
NOI = Effective gross income − Operating expenses
Note that mortgage payments are not operating expenses. NOI is deliberately debt-free so properties can be compared regardless of financing.
Cap rate = NOI/(Purchase price)
Breakeven occupancy = (Operating expenses + Debt service)/(Gross annual rent)
Each percentage point of vacancy costs exactly 1% of gross rent: here $288 a year.
Worked Example
Take a $300,000 single-family rental let at $2,400 a month, underwritten at 8% vacancy, with $11,520 of annual operating expenses and $15,000 of annual mortgage payments.
Step 1: Gross annual rent. $2,400 x 12 = $28,800
Step 2: The vacancy loss. $28,800 x 8% = $2,304
Step 3: Effective gross income. $28,800 - $2,304 = $26,496
Step 4: Net operating income. $26,496 - $11,520 = $14,976
Step 5: Cap rate. $14,976 / $300,000 = 4.99%
Step 6: Cash flow after debt service. $14,976 - $15,000 = -$24
Step 7: Breakeven occupancy. ($11,520 + $15,000) / $28,800 = 92.08%
So the property is breakeven to the dollar, and slightly the wrong side of it. The margin of safety reads Very thin: you need almost full occupancy just to cover costs, and the operating expense ratio is 43.48% of effective gross income.
Carrying it across the vacancy ladder
Each percentage point of vacancy costs exactly 1% of gross rent, or $288 a year, so the sensitivity table walks down in a straight line. Three rows from that computed table:
Step 8: At 0% vacancy. NOI $17,280, cash flow $2,280, cap rate 5.76%
Step 9: At 8% vacancy (the base case). NOI $14,976, cash flow -$24
Step 10: At 16% vacancy, two months empty. NOI $12,672, cash flow -$2,328
Between the optimistic pro forma and the bad year the NOI swings by $4,608, and the cash flow swings by the same amount, because operating expenses and debt service do not fall when the tenant leaves. That is the entire argument for underwriting vacancy honestly: the assumption, not the building, is what moved the cap rate from 5.76% to 4.99%.
Step 11: The same property owned outright. ($11,520 + $0) / $28,800 = 40.00% breakeven occupancy
Leverage is what makes the occupancy requirement punishing. Strip the mortgage out and the property only has to be let five months of the year to cover its own costs; add the mortgage back and it needs eleven.
What does this calculator not account for?
- Turnover costs beyond lost rent. Cleaning, painting, repairs and letting fees all arrive alongside a vacancy and are not captured by the vacancy rate alone.
- Rent growth and expense inflation, which move in different directions over a hold period.
- Capital expenditure. Roofs, boilers and windows are not operating expenses but they are real, and reserves for them should be in the expense figure.
- Bad debt. A tenant who stays but stops paying is worse than a vacancy, and is not the same line item.
- Seasonality. Family rentals turn over in summer; student lets have fixed cycles that concentrate vacancy risk.
- Tax. Depreciation, mortgage interest deductibility and eventual recapture all change the after-tax picture materially.
- Appreciation. This is an income measure. Total return includes value growth, which for many investors dominates.
- Financing terms. Debt service is taken as given; the split between principal and interest is not modelled here.
What mistakes do people make with this?
- Underwriting at zero vacancy. The single most common error in amateur rental analysis. It inflates the cap rate here by 0.77 points, which is the difference between a marginal deal and an attractive one.
- Putting mortgage payments in operating expenses. NOI excludes debt deliberately, so that properties can be compared independently of how they are financed. Including it makes your cap rate meaningless.
- Forgetting capital reserves. A property with no reserve line is not cheaper to run, it is being underfunded. Roofs fail on a schedule you do not control.
- Ignoring breakeven occupancy. A 5% cap rate sounds fine until you notice the property needs 92% occupancy to break even, which leaves almost no margin.
- Treating the vacancy rate as the whole cost of turnover. Lost rent is only part of it. Re-letting costs arrive at the same moment.
- Using market vacancy for your specific unit. A neighbourhood average tells you little about a particular property with a particular manager.
Frequently Asked Questions
What vacancy rate should I use?
Why does vacancy matter so much?
Is the mortgage an operating expense?
What is breakeven occupancy?
Why did my cap rate fall when I added vacancy?
Does a lower purchase price fix a thin deal?
Sources
- U.S. Census Bureau, Housing Vacancies and Homeownership (CPS/HVS). census.gov/housing/hvs/index.html
Also consulted: Standard real estate income analysis. Net operating income, cap rate, effective gross income and breakeven occupancy are conventional definitions with no jurisdictional content; The convention that NOI excludes debt service, so that properties can be compared independently of financing, is applied throughout.