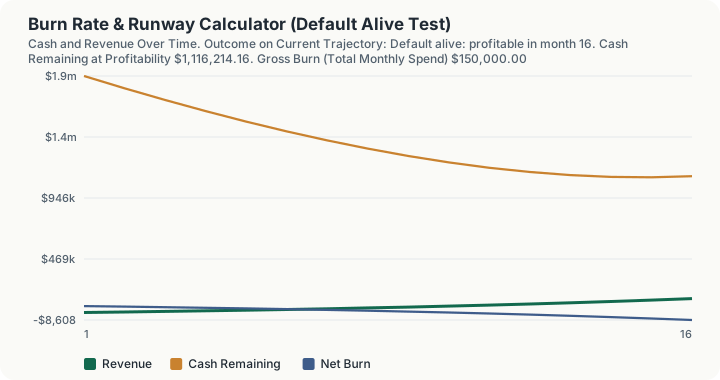
Quick Answer: With $2,000,000 in the bank, $150,000 of monthly costs and $50,000 of revenue growing 8% a month, the static runway says 20 months, but the real answer is default alive: profitable in month 16, with $1,116,214 still in the bank. Remove the growth and the same company is default dead in month 20. Let costs grow at 8% too and it dies in month 13, sooner than the static figure suggested.
What does this calculator do?
Two numbers describe how fast a company consumes cash. Gross burn is total monthly spend. Net burn is spend less revenue, and net burn is what actually drains the bank.
Dividing cash by net burn gives the static runway, which is the figure most people quote. It assumes nothing changes, and for a growing company that assumption is always wrong: in one direction or the other.
The better question is Paul Graham's: are you default alive? On your current trajectory, without raising another round, do you reach profitability before the money runs out? That is a different question from how many months of cash you have, and it has a different answer.
Here the static runway of 20 months understates the position: revenue growth reaches breakeven in month 16. But if costs grow at the same rate as revenue, the company dies in month 13, well short of the static estimate. Growth cuts both ways.
How is this calculated?
Gross burn is monthly expenses. Net burn is expenses less revenue:
Net burn = Expenses − Revenue
Static runway divides cash by net burn:
Static runway = Cash/(Net burn)
Dynamic runway simulates month by month, compounding revenue and expenses at their own growth rates:
Revₘ = Rev₀(1 + gᵣ)^(m − 1); Expₘ = Exp₀(1 + gₑ)^(m − 1)
Cash falls by the net burn each month. Default alive means the net burn turns negative, revenue overtakes expenses, before the cash reaches zero.
Worked Example
A seed-stage company has $2m in the bank, spends $150,000 a month, brings in $50,000 a month, and is growing revenue 8% month over month with expenses flat. The founder wants to know whether they are default alive.
Step 1: Gross burn. Total monthly expenses = $150,000
Step 2: Net burn. $150,000 expenses - $50,000 revenue = $100,000 a month
Step 3: Static runway. $2,000,000 / $100,000 = 20.0 months
Step 4: Burn multiple. $100,000 net burn / $50,000 revenue = 2.00x
Two dollars of cash consumed for every dollar of revenue produced. Step 3 is the number most founders quote, and it is the one that is wrong, because it holds revenue still.
Letting Revenue Compound: Months One and Two
Step 5: Month one cash consumed. $150,000 - $50,000 = $100,000
Step 6: Cash remaining after month one. $2,000,000 - $100,000 = $1,900,000
Step 7: Month two revenue after 8% growth. $50,000 x 1.08 = $54,000
Step 8: Month two cash consumed. $150,000 - $54,000 = $96,000
Step 9: Cash remaining after month two. $1,900,000 - $96,000 = $1,804,000
Step 10: The running total against the static forecast. $2,000,000 - $1,804,000 = $196,000 consumed in two months, against the $200,000 the flat-revenue model predicted
Four thousand dollars is a rounding error at month two. Compounded, it is the whole answer.
Step 11: The month revenue overtakes expenses. Revenue passes $150,000 in month 16
Step 12: Cash left at that point. = $1,116,214.16
Verdict: default alive. The company reaches profitability with more than half its cash intact, five months inside a runway that on the static reading looked like a hard deadline.
With no revenue growth: the static runway is the real runway. Default dead in month 20.
With expenses also growing 8%: revenue never catches up, because both compound at the same rate on a smaller base. Default dead in month 13: seven months worse than the static figure implied.
With growth of only 4%: still default alive, but profitability slips to month 30, consuming far more cash on the way.
What does this calculator not account for?
- Lumpy cash flows. Annual contracts, tax payments and equipment purchases do not arrive smoothly.
- Working capital. Revenue recognised is not cash collected. A business with 90-day receivables burns cash faster than this suggests.
- Deferred revenue. Cash collected upfront on annual plans improves the cash position without improving the profit and loss.
- The financing you might raise, and the time it takes. Most investors want to see runway, so raising becomes harder precisely as it becomes more necessary.
- Non-linear costs. Hiring is stepwise, not smooth. Adding a person changes the burn by a discrete amount.
- Churn. Growth here is net of nothing. Real revenue growth must survive customers leaving.
- Whether the growth rate is sustainable. 8% a month is 151% a year. Few companies sustain that for long, and the model assumes it continues indefinitely.
- Runway conventions. Many investors want 18 to 24 months at the point of raising, which is a different threshold from simply surviving.
What mistakes do people make with this?
- Quoting the static runway to a board or investor. It is the wrong number for a growing company, and everyone in the room knows it.
- Assuming growth always extends runway. It only does if costs grow more slowly. Here matching growth rates makes the runway shorter than static, not longer.
- Confusing gross and net burn. Gross burn is what you spend; net burn is what you lose. Companies with meaningful revenue often quote gross burn and sound worse than they are.
- Ignoring collections. Revenue on the income statement is not cash in the bank. Slow receivables can make a default-alive company default dead.
- Planning to raise at the end of the runway. Investors read short runway as leverage or as risk. Raising is much easier at twelve months than at three.
- Extrapolating a good month. Compounding an unusually strong month for two years produces a fantasy.
Frequently Asked Questions
What is the difference between gross and net burn?
What does default alive mean?
Why is my dynamic runway shorter than the static one?
How much runway should I have before raising?
Does revenue growth always help?
What is a good burn multiple?
Sources
- U.S. Small Business Administration, the official authority for the business this calculator relates to. sba.gov
Also consulted: Standard cash flow mathematics. Gross burn, net burn and runway are arithmetic definitions with no jurisdictional content; The default alive test follows Paul Graham's formulation: whether a company reaches profitability on its current trajectory before exhausting its cash.