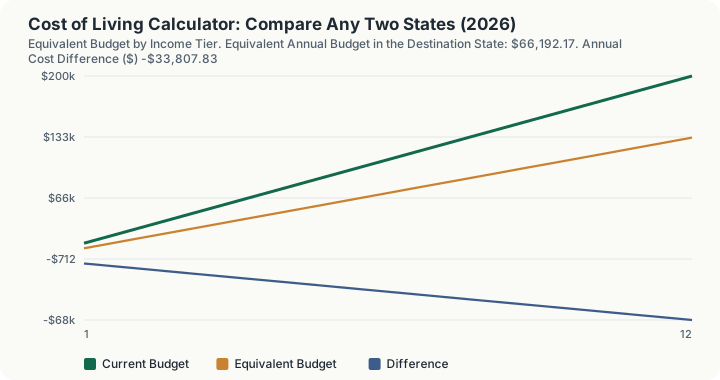
Quick Answer: Moving from California (composite index 140.5) to Texas (index 93.0), a $100,000 budget buys the same basket for $66,192.17 a year, a saving of $33,807.83, or 33.8%.
What does this calculator do?
Most people who search for a cost of living calculator are not asking an abstract question about price levels. They are asking whether a specific move works: the offer in Austin against the life in San Jose, the retirement in Florida against the house in Westchester. That is a two-state question, so this calculator takes two states.
You pick the state you live in now, the state you are considering, and what you spend or earn per year today. The result is the annual budget that buys the same basket of goods in the destination. Every one of the 50 states is selectable on both sides, and the same page reports where each state sits in the national ranking, so you can see whether the move is a small adjustment or a change of category.
The index behind it is the MERIC composite cost of living series, where the United States average is 100.0. Across the 50 states the composite runs from Oklahoma at 83.5 to Hawaii at 184.8. Twenty seven states sit below the national average, so a majority of moves between randomly chosen states are cheaper than the national picture suggests. The unweighted average of the 50 state indices is 104.2, which is above 100.0 because the expensive states are further from the mean than the cheap ones.
The extremes of the 2026 index
- Most expensive: Hawaii 184.8 (rank 1), Massachusetts 147.8 (rank 2), California 140.5 (rank 3), New York 134.5 (rank 4)
- Least expensive: Oklahoma 83.5 (rank 50), Alabama 85.0 (rank 49), Mississippi 86.2 (rank 48), Kansas 87.5 (rank 47)
How is this calculated?
The calculation is a ratio of two composite indices. Nothing else happens to your budget.
Equivalent Budget = Current Budget × (Destination Composite Index)/(Origin Composite Index)
Cost Difference = Equivalent Budget − Current Budget
Cost Difference % = (Cost Difference)/(Current Budget) × 100
- Two index lookups. The composite index and national rank for the origin state and for the destination state are read from the 2026 MERIC state table. Nothing else in that table is used by the calculation.
- Ratio scaling. Your current budget is multiplied by the destination index and divided by the origin index. Because both indices are measured against the same national base of 100.0, the base cancels and the ratio is the direct purchasing power conversion between the two states.
- Difference. The equivalent budget minus your current budget gives the dollar difference, and that difference over your current budget gives the percentage. A negative number means the destination is cheaper.
- Rank change. The origin rank minus the destination rank, reported so you can see how far up or down the national table the move takes you.
This is a single composite scaling. Your spending is not split into housing, groceries, utilities, transport and healthcare, and those categories are not weighted separately anywhere in the code. The MERIC composite already carries category weights inside it, from a national basket, and this calculator applies that composite as one number.
Worked Example
Take the default scenario: a household spending $100,000 a year in California, considering a move to Texas.
- Origin index. California's composite index is 140.5, rank 3 of 50. Prices there run 40.5% above the national average.
- Destination index. Texas is 93.0, rank 34 of 50, so 7.0% below the national average.
- Ratio. 93.0 divided by 140.5 is 0.661922, or 66.2% of California prices.
- Equivalent budget. $100,000 times 0.661922 is $66,192.17.
- Difference. $66,192.17 minus $100,000 is a saving of $33,807.83 a year, or 33.8%.
- Rank change. From rank 3 to rank 34, a move of 31 places down the expense table.
The practical reading: a $100,000 California lifestyle needs roughly $66,000 in Texas, so a Texas offer below that figure is a real pay cut in purchasing power terms even if the headline salary looks similar. Run it the other way and the same logic bites harder. A $100,000 Mississippi budget (index 86.2) needs $214,385.15 in Hawaii (index 184.8), because you are crossing from rank 48 to rank 1.
What does this calculator not account for?
- Taxes. State income tax, sales tax and property tax are not in the composite index and are not applied here. This matters most on exactly the moves people run: California to Texas swaps a state income tax for none, and that is a separate calculation from this one.
- Metro variation inside a state. A state composite is a single number for the whole state. Manhattan and Buffalo share New York's 134.5, and Austin and Amarillo share Texas's 93.0. For a move between two large metros the state figure can understate the gap badly.
- Category exposure. A household paying market rent has far more housing exposure than the composite assumes, and a household that owns outright has far less. The composite carries a national average weighting, not yours.
- Moving costs, and the one-off expenses of relocating. Nothing here is amortized over the move.
- Salary levels. This converts a budget, not an offer. Local wages differ from local prices, and the two do not move together reliably.
- Housing tenure change. Selling in one state and buying in another involves transfer taxes, agent commission and mortgage rate changes that no index ratio captures.
What mistakes do people make with this?
- Reading the percentage as a salary target. A 33.8% lower cost of living does not mean you should accept 33.8% less pay. Cost of living converts spending; savings rate, retirement contributions and taxes all sit outside the index and typically make the required salary higher than the raw conversion.
- Comparing two cities using state numbers. This is the most common misuse. If both ends of your move are specific metros, the state composite is a rough anchor, not the answer.
- Assuming the ratio is symmetric in percentage terms. California to Texas is 33.8% cheaper, but Texas to California is 51.1% more expensive. The dollar conversion is reversible; the percentages are not, because the denominator changes.
- Treating a small index gap as meaningful. The difference between rank 24 and rank 30 is a couple of index points, well inside the noise of a quarterly survey. Rank matters at the extremes, not in the middle.
- Forgetting that low cost of living states often have their own taxes. Several of the cheapest states on this index levy sales and property taxes that offset part of the gain. The index does not net that out.
Frequently Asked Questions
Which state has the highest cost of living?
Which state has the lowest cost of living?
What does a cost of living index of 100 mean?
Does this include state income tax?
Why does the calculator not break my budget into housing, food and utilities?
How often does the underlying index change?
Can I compare a state with itself?
Sources
- MERIC (Missouri Economic Research and Information Center), Cost of Living Data Series, meric.mo.gov/data/cost-of-living-data-series
- U.S. Bureau of Economic Analysis, Regional Price Parities by State. bea.gov/data/prices-inflation/regional-price-parities-state-and-metro-area
- U.S. Bureau of Labor Statistics, Consumer Price Index for All Urban Consumers (CPI-U) bls.gov/cpi
Also consulted: Council for Community and Economic Research (C2ER), Cost of Living Index methodology.