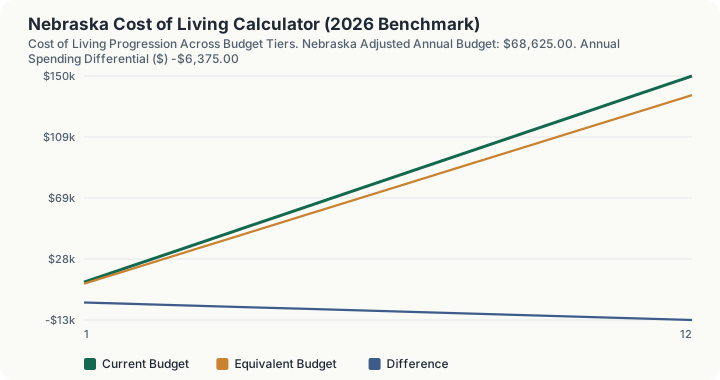
Quick Answer: Nebraska's cost of living is 8.5% below the U.S. national average (composite index 91.5), so a $75,000.00 national-average household budget costs about $68,625.00 a year in Nebraska.
The 8.5% Discount, and Where It Comes From
Nebraska is a Great Plains state. On MERIC's composite cost-of-living index it registers 91.5, or 8.5% below the 100.0 national baseline.
Within the Midwest, Nebraska is roughly mid-pack among Midwestern states. The composite figure is driven mainly by housing (index 80.2), with utilities (index 93.5) and groceries (index 97.4) playing smaller roles.
That combination puts Nebraska in the more affordable lower third of state rankings, a useful anchor point for anyone weighing a cross-state move, a remote-work relocation, or a corporate cost-of-labor adjustment against the national average. It is also worth remembering that a single statewide figure can't capture the spread between Nebraska's own metro and rural markets.
That translates to roughly $6,375 of annual budget movement on a $75,000 reference figure, driven largely by housing running 19.8 points below the 100.0 mark. Transportation, healthcare, and general goods and services are folded into the composite calculation too, even though MERIC does not publish them as standalone state indices.
Key Index Components for Nebraska:
- Composite Benchmark Index: 91.5 (Rank #39)
- Housing Cost Index: 80.2
- Utilities Cost Index: 93.5
- Grocery Cost Index: 97.4
How This Is Calculated
Nebraska's composite of 91.5 rests on a housing index of 80.2, close to 20 points under the national line. Groceries at 97.4 and utilities at 93.5 contribute far less. Rank 39 of 50. That composite is the multiplier the calculator applies.
- Baseline budget. You enter annual household spending priced at the national benchmark, index 100.0.
- Composite lookup. Nebraska's composite index of 91.5 is read from the 2026 MERIC state table, along with its rank of #39 among the 50 states.
- Single-factor scaling. The baseline is multiplied by 91.5 and divided by 100. Housing 80.2, groceries 97.4 and utilities 93.5 are reported for context and not reweighted here, since the composite already embeds MERIC's weights. With groceries less than three points below parity, the food line in a Nebraska budget looks close to national even though the total does not.
- Differential. The dollar and percentage difference against the baseline is taken from the scaled result, which is what the headline output and the monthly view report.
Worked Example
Using this calculator's baseline scenario: a household needing $75,000.00 a year to sustain a standard basket of goods (housing, groceries, utilities, transportation, and healthcare), priced at the U.S. national average (composite index 100.0).
- National baseline. $75,000.00 is the reference spending level at the national-average price level (index 100.0).
- Apply Nebraska's composite index. Nebraska's composite index of 91.5 (rank #39 nationally) means local prices run 8.5% below the national basket. Scaling: $75,000.00 × (91.5 ÷ 100) = $68,625.00.
- Dollar differential. $68,625.00 − $75,000.00 = -$6,375.00, so a household living in Nebraska needs its budget to shrink by that amount to match the same standard of living.
- Percentage and monthly view. That is -8.5% of the baseline, or $5,718.75/mo in Nebraska versus $6,250.00/mo nationally.
Nebraska runs meaningfully cheaper than the national baseline, with housing costs (index 80.2, 19.8 points below average) the largest single driver of the gap.
What the Multiplier Schedule Is Actually Doing
The twelve rows under the result are twelve applications of the same composite index. Only one thing changes as you read down: the budget tier steps up by a sixth of your entry each time. The index stays at 91.5 on every row, so the column is a single measure and can be read straight down.
Row 1 takes a $12,500 tier and returns $11,437.50. Row 2 takes $25,000 and returns $22,875.00. Row 3 takes $37,500 and returns $34,312.50. Row 4 takes $50,000 and returns $45,750.00. The step between consecutive rows is a constant $11,437.50, because each row adds one more sixth of the entered budget priced at 91.5, and row 12 closes the table at $137,250.00 on a $150,000 tier.
Row 6 is the row most readers want, because it uses your entered budget. At $75,000 it prints $68,625.00, which is the headline figure exactly. Scanning to your own budget in the table and stopping there gives the same answer as reading the top of the page, and the Difference beside it, -$6,375.00, is the same 8.5% of the tier that every other row carries.
The housing-index shortcut, priced. The correct figure is $75,000 x 91.5 / 100 = $68,625.00, a saving of $6,375.00 against the national baseline. Pricing the entire budget at Nebraska's housing index of 80.2 instead gives $60,150.00 and a saving of $14,850.00. The housing-only method more than doubles the apparent discount, because Nebraska's cheap housing is not matched by equally cheap groceries at 97.4.
Each additional $1,000 of national-baseline budget costs $915.00 in Nebraska. Raising the entry from $75,000 to $76,000 moves the adjusted figure from $68,625.00 to $69,540.00. The differential percentage holds at -8.5% at every budget level, because one factor is doing all the work.
The reverse question: what national-average budget matches $100,000 of Nebraska spending? A $109,289 baseline adjusts to $99,999.44 and $109,290 adjusts to $100,000.35. So a household spending $100,000 in Nebraska is living at roughly a $109,290 national standard, and that $9,290 gap is the entire content of this calculator.
What This Does Not Account For
- No category weighting is performed. The engine multiplies your budget by the single composite figure of 91.5. The housing index of 80.2, the grocery index of 97.4 and the utilities index of 93.5 are shown for context and are never combined or applied to portions of your budget.
- No household-size or composition adjustment exists. A single person and a family of five both receive $68,625.00 from a $75,000 entry, because the budget figure is the only input the engine reads.
- Intra-state variance between major metropolitan urban centers and rural counties within Nebraska. One statewide 91.5 applies everywhere, so Omaha and a rural county both return $68,625.00 on a $75,000 budget.
- Discretionary lifestyle choices, private schooling, and luxury expenditures.
- State income and property tax impacts on disposable take-home salary.
- Dynamic seasonal utility price surges during peak winter heating or summer cooling months.
Common Pitfalls
- Comparing State Averages Instead of Metro Areas: Living in a major metro area is often 20%-40% more expensive than the statewide average.
- Focusing Solely on Housing: Overlooking higher utility, transportation, or food costs in colder or remote regions.
- Ignoring Net Take-Home Pay: Comparing gross salary without factoring in state income and sales tax differentials.
- Failing to Adjust for Family Size: Larger households experience disproportionately higher grocery and healthcare expenditures.
Frequently Asked Questions
Is Nebraska expensive to live in?
What is the biggest cost factor in Nebraska?
How much salary do I need to maintain my lifestyle in Nebraska?
How often are cost of living indices updated?
Sources
- U.S. Bureau of Economic Analysis (BEA): Regional Price Parities. bea.gov/data/prices-inflation/regional-price-parities-state-and-metro-area
- U.S. Bureau of Labor Statistics (BLS): Consumer Expenditure Survey. bls.gov/cex
- Nebraska Department of Revenue, the official state tax authority for Nebraska rates, rules and forms. revenue.nebraska.gov
Also consulted: MERIC: Cost of Living Data Series (2025/2026).