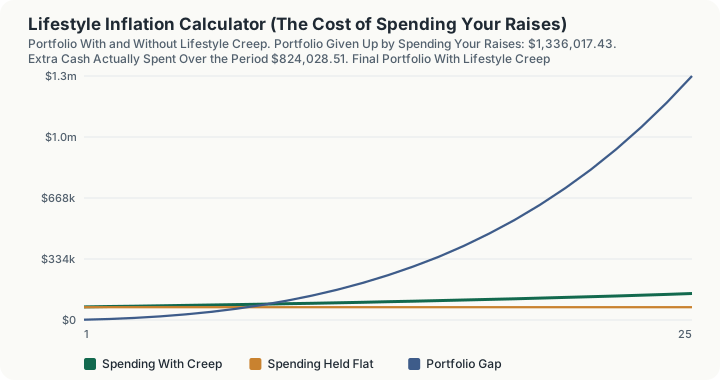
Quick Answer: Absorbing half of every 4% raise into spending, from a $90,000 salary and $70,000 of spending, costs $1,336,017.43 of portfolio over 25 years at a 6% return. It also raises the retirement target from $1,750,000 to $3,624,065.87, so the full two-sided shortfall is $3,210,083.30. Each extra dollar actually spent costs $1.62 of final portfolio.
What does this calculator do?
Lifestyle inflation is not a moral failing and this page does not treat it as one. It is a decision, made a little at a time and usually without being made explicitly: when a raise arrives, some of it is absorbed into the way you live and some of it is not. This calculator models two futures that differ in that one variable and prices the gap between them.
What makes the arithmetic worth doing is that the cost lands twice. The obvious half is the portfolio: money spent is money not invested, and over decades the compounding on it is worth more than the money itself. At the defaults, $824,028.51 of extra cash spent over 25 years costs $1,336,017.43 of final portfolio, a multiple of $1.62 per dollar.
The second half is quieter and usually larger. A higher standard of living has to be funded forever, not just until retirement. Because the retirement target is final-year spending divided by the safe withdrawal rate, absorbing raises raises the finish line at the same time as it slows you toward it. Here the target rises by $1,874,065.87, more than the portfolio shortfall itself.
Two notes on interpretation. Everything is nominal and pre-tax: salary, spending and the return are in the same nominal units, and no tax is deducted from salary before spending. And the damage is exactly linear in the share of each raise spent, so the honest framing is not "spend nothing" but "decide what fraction, knowing the price".
How is this calculated?
Salary compounds at the raise rate. Spending in the creep path rises by the spent share of each raise, which telescopes to a simple expression; in the held path it never moves:
Sₜ = S₀(1 + r)ᵗ; Eₜ^(creep) = E₀ + k × (Sₜ − S₀); Eₜ^(held) = E₀
Each year's saving is salary less spending, compounded at the investment return with contributions made at the end of the year:
Pₜ = P_(t − 1)(1 + i) + (Sₜ − Eₜ)
Step 1: Apply the first raise. $90,000 x 1.04 = $93,600, so the raise is $3,600
Step 2: Absorb half of it into spending. $70,000 + 0.50 x $3,600 = $71,800 of spending in the creep path Spending in the held path stays at $70,000
Step 3: Compute each path's saving for the year. Creep: $93,600 - $71,800 = $21,800 Held: $93,600 - $70,000 = $23,600
Step 4: Roll each portfolio forward. Both start at $0, so after year one the balances are $21,800 and $23,600, and the gap is $1,800, exactly half the raise.
Step 5: Repeat for 25 years. Salary reaches $90,000 x 1.04^25 = $239,925.27 Creep spending reaches $70,000 + 0.50 x ($239,925.27 - $90,000) = $144,962.63 Held spending is still $70,000
Step 6: Compare the terminal portfolios. With creep: $2,433,307.67 With spending held flat: $3,769,325.10 The difference is $1,336,017.43
Step 7: Total the cash actually spent above the starting level. Summing each year's excess spending gives $824,028.51
Step 8: Divide one by the other. $1,336,017.43 / $824,028.51 = $1.62 of portfolio lost per dollar spent The amount above $1.00 is purely the compounding the money never did.
Step 9: Compute the retirement target on each path. With creep: $144,962.63 / 4% = $3,624,065.87 Held: $70,000 / 4% = $1,750,000.00 The target rose by $1,874,065.87
Step 10: Add the two halves. $1,336,017.43 + $1,874,065.87 = $3,210,083.30 of total financial impact
Worked Example
The share of each raise spent is the one decision this calculator is about, so the example varies only that.
Step 1: Spend every raise in full. At a 100% share, saving is frozen at its starting level of $20,000 a year for the whole 25 years. Extra cash spent totals $1,648,057.02, and the portfolio forgone is $2,672,034.86.
Step 2: Spend half, the default. Extra cash spent $824,028.51, portfolio forgone $1,336,017.43.
Step 3: Spend only a quarter. Extra cash spent $412,014.25, portfolio forgone $668,008.71.
Step 4: Notice the linearity. $2,672,034.86, $1,336,017.43 and $668,008.71 are in exact proportion to 100%, 50% and 25%. Every point of the raise you bank is worth the same as every other point. There is no threshold and no cliff, which means partial discipline is worth exactly its fraction.
Step 5: Shorten the horizon to ten years. The same 50% share over ten years costs $133,676.21, almost exactly a tenth of the 25-year figure. Extra cash spent is $111,885.81 and the multiplier falls to $1.19 per dollar, because the money has had far less time to compound.
That last comparison is the real shape of the problem. Over a decade lifestyle creep looks like a rounding error, which is precisely why it is allowed to continue. Over a career it is worth more than most people's houses.
Carrying The Default Case Forward
Take the 50% share from step 2 and watch it accumulate rather than comparing it against the alternatives.
Step 6: Year one. Spending with creep $71,800, spending held flat $70,000, portfolio gap $1,800
Step 7: Year two. Spending with creep $73,672, still $70,000 held flat, and the gap has more than tripled to $5,580 because year one's forgone saving is now invested and compounding too
Step 8: Year ten. Spending with creep $91,610.99, portfolio gap $133,676.21
Step 9: Year twenty-five. Spending with creep $144,962.63, portfolio gap $1,336,017.43
Step 10: What the last year's creep costs on its own. $144,962.63 - $70,000.00 = $74,962.63 of annual spending that did not exist at the start
The gap is $1,800 after one year and $5,580 after two. Nobody changes their behaviour over $1,800, and that is exactly the mechanism: the decision is invisible for a decade and irreversible by year twenty-five, because the compounding of forgone saving is doing most of the damage rather than the spending itself.
What does this calculator not account for?
- Tax. Salary, spending and the raise are all pre-tax, and no tax is deducted before spending. A real household spends after-tax money, so the absolute figures are optimistic on both paths.
- Inflation. Everything is nominal. Holding spending flat for 25 years in nominal terms means a substantial real cut in living standards, and this model treats that as costless. It is not.
- Salary paths that are not smooth. A constant annual raise rate is applied. Real careers deliver promotions, plateaus, job changes and gaps.
- Sequence-of-returns risk. A single constant return is applied every year.
- One-off spending. The model has no room for a house deposit, a wedding or a car, which are lumps rather than a permanent uplift in the run rate.
- Whether the extra spending bought anything. The calculator prices the financial cost and says nothing about the value received. A larger home near better schools and an unexamined subscription creep are the same number here.
- Any change in the withdrawal rate, contribution limits, employer match, or the tax character of the savings.
- The starting portfolio's effect on the gap. It grows identically in both futures, so it changes both terminal balances and changes the gap between them not at all.
What mistakes do people make with this?
- Judging lifestyle creep over a few years. At ten years the cost is $133,676.21; at twenty-five it is $1,336,017.43. It is a slow problem that becomes enormous late, and the early evidence always says it is fine.
- Looking only at the portfolio shortfall. The retirement target rose by more than the portfolio fell. Ignoring the second effect understates the damage by more than half.
- Assuming the raise is what costs you. It is not; the raise is income. What costs you is the share of it absorbed permanently into the run rate, and that share is a choice you can set to anything.
- Comparing the dollar spent to the dollar not invested. At the defaults the exchange rate is $1.62 of final portfolio per dollar spent, not $1.00, and over longer horizons it is worse.
- Reading "spending held flat" as a realistic plan. In nominal terms over 25 years it is not. Its role here is as a clean counterfactual, not as advice.
- Confusing this with a savings rate model. The savings rate here is an output of the two spending paths, not an input, which is why banking a raise raises it automatically without any further decision.
Frequently Asked Questions
What is lifestyle inflation, or lifestyle creep?
How much does lifestyle creep actually cost?
Why does each dollar spent cost more than a dollar?
Is it worse to spend a raise than to have never received it?
Should I bank every raise?
Why does raising spending increase my retirement number so much?
Sources
- Board of Governors of the Federal Reserve System, the official authority for the inflation this calculator relates to. federalreserve.gov
This calculator uses no statutory data and no published tables. Every input is supplied by the user and the arithmetic is deterministic compounding.
Also consulted: The 4% safe withdrawal rate used to convert spending into a retirement target is an assumption, not an authority's figure. It comes from historical backtests of US portfolios over thirty-year retirements and is an input on this page precisely so you can change it; The expected return and the raise rate are likewise your assumptions. No source exists for a future value of either.