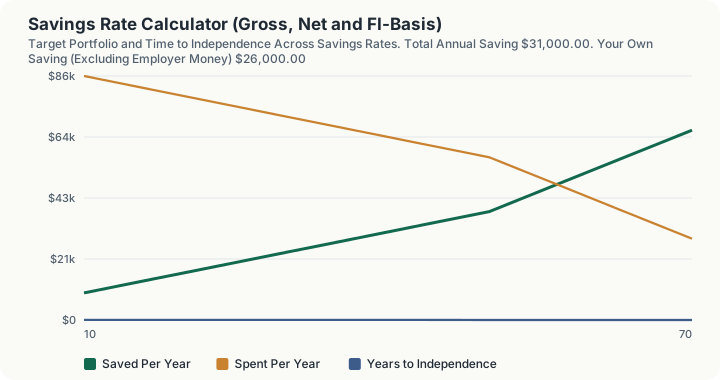
Quick Answer: One household honestly reports three different savings rates: 32.63% on the FI basis, which is saving divided by saving plus spending, 32.63% of take-home pay, and 24.80% of gross income. All three are correct and they answer different questions. Total saving is $31,000 against $64,000 of spending, and at a 5% real return that puts full independence 20.41 years away.
What does this calculator do?
A savings rate is a fraction, and almost every rate you will ever be quoted leaves the denominator unstated. That is not pedantry. The same household, with the same bank statements, honestly produces rates that differ by eight percentage points or more depending on which of three defensible denominators is used, and the gap is the single most common reason two people discussing this number talk past each other.
Gross income is the lowest denominator's counterpart and the largest denominator: it includes tax you never saw. Take-home is what most people mean when they say savings rate. The FI basis, saving divided by saving plus spending, is the highest, and it is the only one that maps directly onto time to financial independence, because time to independence depends on the ratio of what you build to what you have to fund, and income cancels out of that question entirely.
This page returns all three and labels which is which, rather than picking one and hoping.
It also does something the arithmetic makes possible and nothing else on the page needs: it checks whether your budget closes. Money in is gross income plus any employer contribution. Money out is taxes, saving and spending. If those do not balance, the gap is unrecorded cash flow, and it means one of your inputs is wrong.
That check has a sharp consequence worth stating outright. The net rate and the FI-basis rate coincide exactly when the budget reconciles, because take-home plus match and saving plus spending are then the same number. Here both are 32.63%. Any gap between those two rates is not an interesting difference of definition. It is unrecorded cash flow, and it is almost always spending you have not counted.
How is this calculated?
Gross Rate = T/(G + M); Net Rate = T/((G − X) + M); FI Rate = T/(T + E)
where $T$ is total saving including any counted employer contribution $M$, $G$ is gross income, $X$ is taxes and $E$ is spending. The reconciliation is:
U = (G + M) − (X + T + E)
Step 1: Total the household's own saving. $15,000 of your own retirement contributions + $5,000 of taxable deposits + $6,000 of mortgage principal + $0 of other debt principal = $26,000
Step 2: Add the employer contribution. $26,000 + $5,000 = $31,000 of total saving
Step 3: Compute take-home income. $120,000 - $30,000 of taxes = $90,000 The effective tax rate is $30,000 / $120,000 = 25.00%
Step 4: Compute the gross rate, with the match on both sides. Denominator: $120,000 + $5,000 = $125,000 $31,000 / $125,000 = 24.80%
Step 5: Compute the net rate. Denominator: $90,000 + $5,000 = $95,000 $31,000 / $95,000 = 32.63%
Step 6: Compute the FI-basis rate. Denominator: $31,000 + $64,000 = $95,000 $31,000 / $95,000 = 32.63%
Step 7: Note that steps 5 and 6 produced the same number, and why. Take-home plus match is $95,000. Saving plus spending is $95,000. They are equal because the budget balances, and that equality is the reconciliation test in a different costume.
Step 8: Run the reconciliation explicitly. Money in: $120,000 + $5,000 = $125,000 Money out: $30,000 taxes + $31,000 saving + $64,000 spending = $125,000 $125,000 - $125,000 = $0 unaccounted
Step 9: Measure the denominator spread. 32.63% - 24.80% = 7.83 percentage points between the highest and lowest defensible rate for the same household
Step 10: Price the employer match trap. Counting the $5,000 match in savings but not in income gives $31,000 / $120,000 = 25.83%, against the correct 24.80%. That is an overstatement of 1.03 percentage points, for a match worth 4% of gross.
Step 11: Note how much of the saving is illiquid. $6,000 of mortgage principal out of $31,000 of total saving = 19.35%. It raises net worth exactly like a deposit does and you cannot spend it.
Step 12: Take the consequence. Target: $64,000 / 4% = $1,600,000 Coverage today: $200,000 x 4% = $8,000 against $64,000 of spending = 12.50% Years to independence: 20.41 years at a 5% real return
Worked Example
The most useful thing this page does is catch a budget that does not close, so the example breaks one on purpose.
Step 1: Take the reconciling case as the baseline. Money in $125,000, money out $125,000, unaccounted $0. Net rate 32.63%, FI-basis rate 32.63%. Identical, as they must be.
Step 2: Now understate spending by $10,000. Enter $54,000 of annual spending instead of $64,000, changing nothing else.
Step 3: Recompute the FI-basis denominator. $31,000 + $54,000 = $85,000
Step 4: Recompute the FI-basis rate. $31,000 / $85,000 = 36.47%
Step 5: Note that the net rate did not move. It is still $31,000 / $95,000 = 32.63%, because nothing in its numerator or denominator changed.
Step 6: Read the gap. 36.47% against 32.63% is a 3.84 point gap that did not exist before, and the reconciliation line now reports $10,000 of income that is neither taxed, saved nor accounted for as spending.
Step 7: Draw the conclusion. The apparently better savings rate is an artefact of the missing $10,000. Real spending is higher than entered, and the true rate is lower than every rate shown. This is why the page reports the reconciliation rather than quietly producing the more flattering number.
What does this calculator not account for?
- The tax character of the savings. A pre-tax dollar and a Roth dollar are counted alike, though they are not worth the same in retirement.
- Unvested employer contributions, which are counted in full here and may never be received.
- Investment returns inside the year. Saving is a flow; growth on the existing portfolio is not part of any rate on this page.
- Irregular income, bonuses, and any timing of contributions within the year.
- Inflation, except through whatever real return you supply for the independence figure.
- Home equity appreciation, which is not saving under any definition used here, though the mortgage principal that builds the equity is.
- Any tax on withdrawals in the time-to-independence calculation, which inherits the assumptions of the financial independence primitive: a constant real return, constant spending, and no tax on the drawdown.
- The distinction between a $6,000 mortgage principal payment and $6,000 into an index fund, beyond reporting the illiquid share. They are counted as equal saving and they are not equal financial positions.
What mistakes do people make with this?
- Quoting a savings rate without the denominator. Here the same household is at 24.80%, 32.63% or 32.63% depending on the question. All three are honest and they are not interchangeable.
- Adding the employer match to savings but not to income. It reports 25.83% instead of 24.80%, an overstatement of 1.03 points for a match worth 4% of gross. The larger the match, the larger the error.
- Counting the whole mortgage payment as saving. Only the principal portion builds net worth. The interest is spending, and your amortisation schedule has the split; the payment amount does not.
- Guessing annual spending. The reconciliation line exists precisely to catch this, and a guess that is too low inflates the FI-basis rate while leaving the net rate untouched.
- Using a bracket rate for the taxes paid field. The field wants total tax actually paid, federal, state, local and payroll combined, from your return and your pay stubs. A bracket is the rate on your last dollar, not on your income.
- Ignoring the illiquid share. Nearly a fifth of the saving here is mortgage principal. A household that describes itself as saving a third of its income and cannot access a fifth of that saving is in a different position from one that can.
- Treating the years-to-independence figure as a forecast. It is a projection from a constant real return and constant spending, and both assumptions are yours.
Frequently Asked Questions
What is a good savings rate?
Which savings rate should I use?
Why are my net and FI-basis rates the same?
Should the employer 401(k) match count in my savings rate?
Does paying down my mortgage count as saving?
Is there an official definition of a household savings rate?
Sources
- The closest official measure is the U.S. Bureau of Economic Analysis personal saving rate, personal saving as a percentage of disposable personal income, published in NIPA Table 2.1: bea.gov/data/income-saving/personal-saving-rate. It is a national aggregate, not a household calculation, and this engine does not use it.
Also consulted: There is no statutory or agency definition of a household savings rate, and no figure on this page is statutory. Every input is supplied by the user; The time-to-independence figure is delegated to engine/primitives/financial-independence.ts and inherits its assumptions: a constant real return, constant spending, and no tax on withdrawals; The 4% safe withdrawal rate and the expected real return are assumptions you choose. Neither comes from any authority, which is why both are inputs.