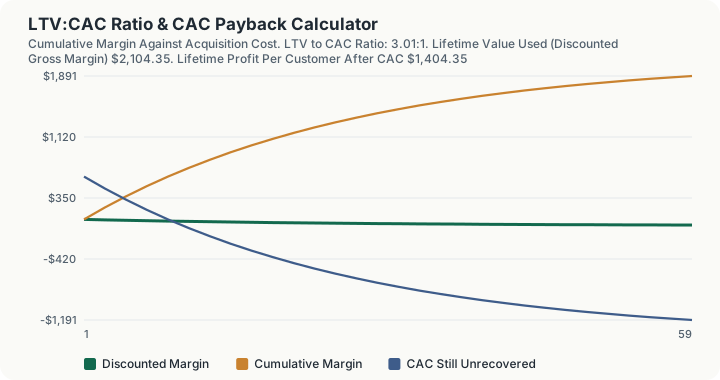
Quick Answer: At $100 monthly ARPU, an 80% gross margin, 3% monthly churn, a $700 acquisition cost and a 10% annual discount rate, the LTV:CAC ratio is 3.01:1. That clears the conventional 3:1 threshold, and gross-margin payback is 8.75 months, so growth here largely self-funds. Measured the flattering way, against naive revenue lifetime value, the same business would report 4.76:1.
What does this calculator do?
The LTV:CAC ratio is the most quoted number in subscription economics and the most easily manipulated. Both halves of the fraction are choices. Put revenue lifetime value on top instead of discounted gross-margin lifetime value and the ratio here jumps from 3.01:1 to 4.76:1 without a single thing changing in the business. Exclude some sales salaries from the denominator and it climbs further.
The 3:1 rule of thumb is a rule of thumb and nothing more. It has no analytical derivation, no authority behind it, and no sensitivity to the thing that actually kills subscription businesses: timing. Acquisition cost is paid today and lifetime value arrives over years, so a company can hold a beautiful ratio while running out of cash. That is why this calculator reports payback period alongside the ratio, and why the payback figure is usually the binding constraint.
Payback has its own trap. The correct denominator is monthly gross margin, not monthly revenue. Using revenue understates the payback period by exactly the margin factor, here it turns a real 8.75 months into a reported 7.00, and it is the single most common error in the metric.
There is a third figure that is more honest than either: the month in which cumulative discounted margin per original customer actually covers acquisition cost. That accounts for the fact that the cohort is shrinking while it repays. It is always later than the simple payback figure.
How is this calculated?
LTV:CAC = (LTV_(discounted gross margin))/CAC; payback months = CAC/A⋅G
LTV_discounted = (A⋅G⋅(1 + d))/(d + m)
Step 1: Compute the monthly gross margin per customer. $100 x 0.80 = $80.00
Step 2: Convert the annual discount rate to a monthly one. 10% / 12 = 0.833%
Step 3: Compute the discounted gross-margin lifetime value. $80.00 x 1.008333 / (0.008333 + 0.03) = $80.67 / 0.038333 = $2,104.35
Step 4: Divide by the acquisition cost to get the ratio. $2,104.35 / $700 = 3.01:1
Step 5: Compute the simple gross-margin payback. $700 / $80.00 = 8.75 months
Step 6: Compute what payback would be if revenue were wrongly used. $700 / $100 = 7.00 months
The gap is exactly the gross margin factor: 7.00 / 0.80 = 8.75. This is the understated figure people quote by mistake.
Step 7: Find the churn-adjusted payback month. Accumulate discounted margin per original customer until it covers $700. Cumulative margin reaches $675.79 by month ten and $729.87 by month eleven, so the acquisition cost is first covered in month 11.
Step 8: Compute lifetime profit after acquisition cost. $2,104.35 - $700.00 = $1,404.35
Step 9: Compute the flattering ratio for comparison. Naive revenue LTV: $100 / 0.03 = $3,333.33. Ratio: $3,333.33 / $700 = 4.76:1
Worked Example
A software business spends $700 of fully loaded sales and marketing to win one customer paying $100 a month, keeps 80% of that as gross margin, and loses 3% of customers a month.
Step 1: The cash goes out. $700 is spent on day one and is gone.
Step 2: Month one brings back $80.00. Remaining unrecovered: $700 - $80 = $620.00
Step 3: Month two brings back $76.96 ($80 x 0.97 survival, discounted one month). Remaining: $543.04
Step 4: Month five. Cumulative discounted margin is roughly $370. Still $330 unrecovered.
Step 5: Month nine. Cumulative is roughly $620. On the simple 8.75-month figure the customer should already be paid back, but the cohort has been shrinking the whole time, so $80 is still outstanding.
Step 6: Month eleven. Cumulative discounted margin reaches $729.87 and the $700 is finally covered. The honest payback is month 11, not month 8.75, and certainly not month 7.
Step 7: The rest is profit. Over the full lifetime, discounted margin totals $2,104.35, leaving $1,404.35 of profit per customer.
Step 8: The verdict. A 3.01:1 ratio with an 8.75-month gross-margin payback clears both the conventional threshold and the cash test.
Now break it in two different ways and watch the two metrics disagree.
Triple the acquisition cost to $2,100. The ratio falls to 1.00:1 and payback stretches to 26.25 months. Both metrics fail together, and obviously.
Instead, double churn to 6% and leave acquisition cost alone. Lifetime value falls to $1,180.49 and the ratio collapses to 1.69:1, but payback is unchanged at 8.75 months, because the simple payback formula contains no churn term at all. This is the case that matters: the payback period is blind to a doubling of churn, and a business watching only payback would see nothing wrong.
What does this calculator not account for?
- No overheads. The ratio compares gross margin to sales and marketing cost. Engineering, general and administrative expense, and everything else sit outside it. That is part of why a 3:1 target exists at all: the headroom is meant to cover what the ratio ignores.
- Constant monthly churn. Real churn is front-loaded, and a front-loaded cohort pays back more slowly than a flat rate implies.
- No expansion revenue. ARPU is flat for the whole lifetime, so a business with strong net revenue retention is understated.
- CAC is a single blended figure. Channel-level acquisition costs frequently differ by a factor of five, and a blended number can hide a channel that is losing money on every customer.
- No lag between spending and winning. Acquisition cost is treated as paid at the moment of the sale, whereas in reality much of it is spent months earlier on customers who never convert.
- The monthly discount rate is the annual rate divided by twelve, a simple division rather than a compounded twelfth root, as stated in the engine's convention.
- The 3:1 threshold is a convention with no authority behind it. The calculator reports whether you clear it because people ask, not because it means anything precise.
- The churn-adjusted payback search runs to 120 months. A cohort whose lifetime margin never covers acquisition cost is reported as never recovering rather than being given a month.
What mistakes do people make with this?
- Using revenue instead of gross margin in the payback denominator. It understates payback by exactly the margin factor: 7.00 months reported against a real 8.75 here. At a 40% margin the same error would report 7.00 against a real 17.50.
- Putting revenue LTV on top of the ratio. It inflates 3.01:1 to 4.76:1 for free. If someone quotes an LTV:CAC ratio, the first question is which LTV.
- Believing the ratio can see churn problems. It can, but the payback figure cannot, and businesses that monitor payback alone will not notice churn doubling.
- Believing payback problems show up in the ratio. They frequently do not. An enterprise business with 1% churn can post a fine ratio on a 25-month payback and still exhaust its cash before the money returns.
- Excluding costs from CAC. Fully loaded means salaries, commissions, tooling, agency fees and the cost of the leads that did not convert. A CAC that includes only advertising spend is not a CAC.
- Treating 3:1 as a pass mark. It is a heuristic. A business with a 3:1 ratio and a 30-month payback is in far more trouble than one at 2.5:1 with a six-month payback.
- Averaging across segments. Blended ratios hide the channels and segments that are unprofitable, and those are precisely the ones you would want to find.
Frequently Asked Questions
Why does the ratio look healthy while the business runs out of cash?
Should I use gross margin or revenue for CAC payback?
Why is the churn-adjusted payback month later than the simple payback figure?
Where does the 3:1 rule come from?
My ratio is below 3:1. Is the business unviable?
Sources
- U.S. Small Business Administration, the official authority for the business this calculator relates to. sba.gov
Also consulted: Discounted gross-margin lifetime value is the perpetuity (AG(1 + d))/(d + m), with survival $(1-m)$ and discounting $(1+d)$ applied each month and cash received at the start of each month; Simple payback is acquisition cost divided by monthly gross margin; Churn-adjusted payback is found by accumulating discounted margin per original customer month by month until it first covers acquisition cost; The monthly discount rate is the annual rate divided by twelve, the stated convention of this engine.
No authority publishes LTV:CAC benchmarks, payback targets, or the 3:1 threshold, and no primary source is cited, because none exists. There is no government, regulatory or standards body that defines these metrics or sets normal ranges. The 3:1 convention is a practitioner heuristic circulated by investors; it is reported here because readers ask about it, not because it carries authority. The default inputs ($100 ARPU, 80% gross margin, 3% monthly churn, $700 CAC, 10% annual discount rate) are illustrative values, not benchmarks. The mathematics is standard and is what the engine implements: