Quick Answer: A $42.00 share price on 120 million shares, against $1.8 billion of revenue, is a price to sales ratio of 2.80x. That sounds modest until it is converted: on the company's actual 5.00% net margin it is a 56.0x earnings multiple. It becomes a 23.3x earnings multiple only if the business one day earns a 12.0% net margin, and a 15x multiple only at an 18.67% margin.
What does this calculator do?
Price to sales is the multiple people reach for when earnings are negative, because it is the one that still returns a number. That is also the reason to distrust it. It prices the top line while saying nothing whatsoever about what share of that line ever becomes profit.
There is a single identity that makes the hidden assumption visible:
P/E = (P/S)/(net margin)
Rearranged, every price to sales ratio is a bet on a margin. "Three times sales" is not a valuation until someone states the margin they expect, at which point it becomes an earnings multiple that can be compared with everything else in the market. This calculator performs that conversion in both directions: it tells you the earnings multiple implied at today's margin and at a margin you nominate, and it solves for the margin that would make the current price an ordinary 15x earnings multiple.
It also reports the enterprise value version of the same ratio, because price to sales is blind to the balance sheet. Two companies with identical revenue and identical share prices can carry wildly different debt loads and produce exactly the same P/S. That insensitivity is not a feature.
How is this calculated?
Step 1: Compute market capitalisation. $42.00 x 120,000,000 shares = $5,040,000,000
Step 2: Divide by revenue. $5,040,000,000 / $1,800,000,000 = 2.80x
Step 3: Compute revenue per share, the per-share view of the same denominator. $1,800,000,000 / 120,000,000 = $15.00 per share
Note that $42.00 / $15.00 is also 2.80x. The multiple is identical whether computed at the company level or per share.
Step 4: Compute the sales yield, the reciprocal. 1 / 2.80 = 0.3571 = 35.71%
Every dollar of market capitalisation buys 35.7 cents of annual revenue.
Step 5: Build enterprise value. $5,040,000,000 + $300,000,000 debt - $500,000,000 cash = $4,840,000,000
Step 6: Compute EV to sales. $4,840,000,000 / $1,800,000,000 = 2.69x
Lower than P/S, because this company holds net cash. A company with net debt produces the opposite result, and P/S would not move at all.
Step 7: Compute the current net margin. $90,000,000 / $1,800,000,000 = 0.05 = 5.00%
Step 8: Convert the sales multiple into an earnings multiple at that margin. 2.80 / 0.05 = 56.0x
Step 9: Convert at the assumed mature margin instead. 2.80 / 0.12 = 23.3x
Step 10: Solve for the margin that would make this a 15x earnings multiple. (2.80 / 15) x 100 = 18.67%
That last figure is the one to argue about. The question is not whether 2.80x sales is expensive; it is whether this business can plausibly earn an 18.67% net margin, because that is the price you are paying.
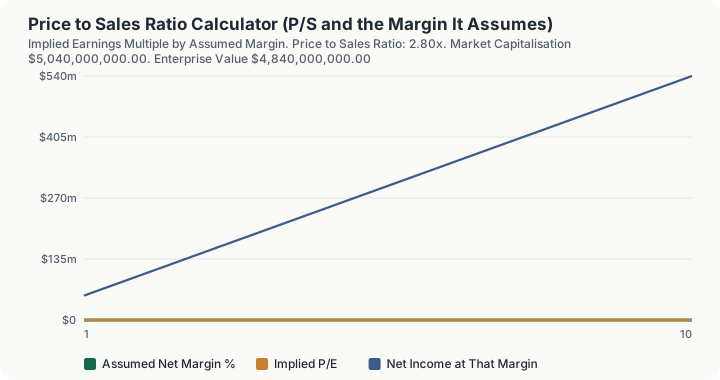
The table sweeps assumed margins from 3% to 30% and prints the implied earnings multiple at each, alongside what net income would be at that margin on the current revenue.
Worked Example
A company with $1.8 billion of revenue, 120 million shares at $42.00, $300 million of debt and $500 million of cash. It earned $90 million last year.
Step 1: Market capitalisation. $5.04 billion
Step 2: The headline multiple. $5.04bn / $1.8bn = 2.80x sales
Against a market where the median company trades somewhere near two times sales, this looks unremarkable.
Step 3: Now use the identity. The company is profitable, so an earnings multiple is available and is the better measure. 2.80 / 0.05 = 56.0x earnings
That is not unremarkable. On the earnings the company actually produces, the price is roughly three and a half times the long-run market average multiple.
Step 4: Ask what margin would justify the price. Suppose you accept a 15x earnings multiple as fair. 2.80 / 15 = 0.1867 = 18.67% net margin required
Step 5: Compare that against what the business earns today. 18.67% required against 5.00% actual. The price assumes margins roughly triple and stay there.
Step 6: Sanity check the target you actually believe. If you think this business matures at a 12.0% net margin: 2.80 / 0.12 = 23.3x earnings
Still a growth multiple, but a defensible one. If you think it matures at a grocery-like 3%, the same 2.80x sales is a 93x earnings multiple and the price is indefensible.
Step 7: Check the balance sheet blind spot. Swap the net cash position for net debt: $900 million of debt against $100 million of cash. Price to sales stays at exactly 2.80x, because nothing in the calculation touched the balance sheet. EV to sales moves from 2.69x to 3.24x. The company got materially more expensive and the headline multiple did not notice.
What does this calculator not account for?
- Whether the assumed margin is achievable. The mature margin is your input. Nothing here validates it against the industry, the cost structure, or the competitive position. It is the single most consequential number on the page and it is unsourced by construction.
- Growth. The multiple is computed on trailing revenue and no growth rate enters anywhere. Two companies at 2.80x sales, one growing 40% and one shrinking, are indistinguishable here.
- Revenue quality. Recurring subscription revenue and one-off hardware revenue are treated identically. So are gross bookings, net revenue, and any aggressive recognition policy.
- Dilution. The share count is a snapshot. Loss-making companies, the ones this multiple is most used for, are also the ones issuing equity and stock compensation heavily, and the future count is not modelled.
- Gross margin. The identity uses net margin only. A business with a 90% gross margin and a business with a 20% one can reach the same net margin by very different routes, with very different durability.
- Anything below the revenue line, at all. That is precisely the point of the ratio and precisely its defect. Losses, leverage, interest, tax and capital intensity are invisible to it.
- Cyclicality. Trailing twelve month revenue at a cycle peak makes the multiple look cheap, and at a trough makes it look expensive, for reasons unrelated to value.
What mistakes do people make with this?
- Treating a low P/S as cheap. A 0.3x sales ratio on a business with a 1% net margin is a 30x earnings multiple. Low sales multiples cluster in low-margin industries for a reason.
- Comparing P/S across industries. Software and grocery retail do not share a scale. The margin conversion is what makes the two comparable, and without it a cross-sector P/S screen is close to random.
- Using P/S when earnings exist. If the company is profitable, the earnings multiple is available and is strictly more informative. The page states plainly whether it is. P/S is the multiple of last resort.
- Ignoring the balance sheet. P/S uses market capitalisation, which excludes debt. A heavily levered company looks identical to a debt-free one. Read the EV to sales line alongside it, always.
- Using basic rather than diluted share count. Unprofitable companies issue heavily. Using the basic count understates market capitalisation and flatters the multiple.
- Mixing consolidated revenue with a partly owned subsidiary. If the income statement consolidates revenue the parent does not fully own, the denominator overstates what shareholders have a claim on.
- Believing the multiple changes when the company takes on debt or turns unprofitable. It does not. Set net income to a loss in this calculator and the 2.80x is unchanged; only the implied earnings multiple disappears. That insensitivity is the flaw the whole page is built to expose.
Frequently Asked Questions
What is a good price to sales ratio?
Why use price to sales at all if earnings are better?
What is the difference between P/S and EV to sales?
How do I choose the mature margin to assume?
Does this work for a company with no revenue?
Why is P/S divided by margin equal to P/E?
Sources
- U.S. Securities and Exchange Commission, Investor.gov, the official authority for the investing this calculator relates to. investor.gov
Also consulted: The price to sales multiple is computed by the engine's shared valuation-yields primitive as market capitalisation over revenue, so the standalone figure and the ratio inside the wider yield block cannot diverge; Enterprise value follows the standard construction: market capitalisation plus total debt less cash and equivalents; The P/E = (P/S) / net margin relation is an algebraic identity, not an approximation, and is applied directly at both the current and the assumed mature margin. The 15x reference used for the "margin needed" figure is a convention chosen for legibility, not a sourced fair value.