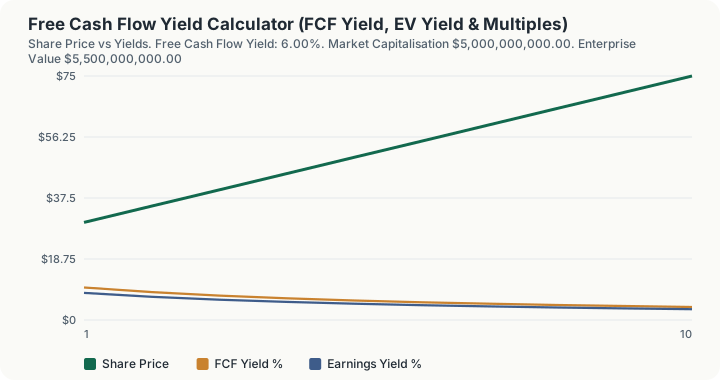
Quick Answer: A company at $50 a share with 100 million shares and $300 million of free cash flow has a free cash flow yield of 6.00%: a 1.50 point spread over a 4.5% risk-free rate. On enterprise value, after adding $800m of debt and deducting $300m of cash, the yield falls to 5.45%, which is what a buyer of the whole business would actually receive.
What does this calculator do?
A yield is just the reciprocal of a multiple, and stating valuation as a yield makes it directly comparable with bonds. A 20x earnings multiple is a 5% earnings yield, which can be set against a 4.5% government bond in a way "20 times earnings" cannot.
Free cash flow yield is the more honest of the two. Net income is an accounting construct shaped by depreciation policy, accruals and non-cash charges. Free cash flow is operating cash less capital expenditure: money the business actually generated and could return to owners.
The gap between them is diagnostic. Here free cash flow is 120% of net income, which is a good sign. When it runs persistently below, the accounting profit is not turning into cash, and that is one of the most reliable warning signs in equity analysis.
Enterprise value matters for the same reason. Equity yield ignores the balance sheet. A leveraged company looks cheaper on equity yield than it is, because the buyer inherits the debt.
How is this calculated?
FCF yield = (Free cash flow)/(Market capitalisation)
Enterprise value = Market cap + Debt − Cash
FCF yield on EV = (Free cash flow)/(Enterprise value)
Earnings yield = (Net income)/(Market cap) = 1/PE
The spread is the FCF yield less the risk-free rate: the excess return you are compensated with for taking equity risk rather than holding government bonds.
Worked Example
Start with a company at $50 a share on 100 million shares, generating $300m of free cash flow against $250m of net income, with $800m of debt and $300m of cash, and a 4.5% risk-free rate to measure against.
Step 1: Market capitalisation. $50 x 100m shares = $5,000m
Step 2: Free cash flow yield on the equity. $300m / $5,000m = 6.00%
Step 3: Enterprise value. $5,000m + $800m debt - $300m cash = $5,500m
Step 4: FCF yield on enterprise value. $300m / $5,500m = 5.45%
The EV yield is the lower of the two because this company carries more debt than cash. An acquirer buying the whole business assumes that debt, so they pay more than the market cap for the same $300m of cash flow.
Step 5: Earnings yield. $250m / $5,000m = 5.00%, the exact reciprocal of the 20.00x PE ratio
Step 6: Cash conversion. $300m / $250m = 120%
Step 7: Spread over the risk-free rate. 6.00% - 4.50% = 1.50 points, which the calculator reads as a thin spread
A point and a half of excess cash yield is not much compensation for equity risk. The verdict field says so rather than leaving the reader to judge 6.00% in a vacuum, which is the whole point of computing the spread instead of quoting the yield alone.
Step 8: Double the share price to $100, nothing else changed. Market cap: $10,000m FCF yield: $300m / $10,000m = 3.00% Spread: 3.00% - 4.50% = -1.50 points
The yield halved because the denominator doubled. Yields and prices move inversely here for the same reason they do on a bond, and at $100 a share the cash yield no longer clears the government bond rate at all.
Step 9: Replace the debt with net cash: no debt, $1,000m of cash. Enterprise value: $5,000m + $0 - $1,000m = $4,000m FCF yield on EV: $300m / $4,000m = 7.50%
Now the EV yield exceeds the equity yield of 6.00%, reversing the relationship in step 4. Net cash makes a business cheaper than its share price suggests, and the equity yield alone cannot see it.
Step 10: Hold the accounting profit and collapse the cash: FCF of $80m against $250m of net income. FCF yield: $80m / $5,000m = 1.60% Cash conversion: $80m / $250m = 32% Spread: -2.90 points
Step 10 is the reason to compute a cash yield at all. The earnings yield is unchanged at 5.00% and the PE is still 20.00x, so every profit-based measure reports the same company as before. Only the cash figures move, and they move a long way.
What does this calculator not account for?
- Growth. A 6% yield on a shrinking business is worse than 4% on a compounding one. Yields are a snapshot, not a forecast.
- Sustainability of the cash flow. One year of free cash flow can be flattered by deferred capital expenditure or working capital release.
- Maintenance versus growth capex. Free cash flow deducts all capital expenditure, which understates cash generation for companies investing heavily in growth.
- Stock-based compensation, which is a real cost to shareholders and is often added back in company-reported free cash flow figures.
- Minority interests and preferred stock, which belong in a full enterprise value bridge.
- Operating leases, now capitalised under current standards but treated inconsistently in older comparisons.
- Pension deficits, which are debt-like and frequently omitted from enterprise value.
- Cyclicality. A cyclical peak year produces a flattering yield precisely when the shares are most expensive.
- Tax. These are pre-tax yields from the investor's perspective.
What mistakes do people make with this?
- Comparing equity yield across companies with different leverage. A heavily indebted company shows a higher equity yield for the same business. The EV yield is the comparable figure.
- Trusting company-reported free cash flow. Definitions vary, and adjusted figures frequently add back stock compensation or exclude particular capital spending. Compute it yourself from the cash flow statement.
- Ignoring cash conversion. Free cash flow persistently below net income is a warning. Above 100% is usually good, though it can also mean underinvestment.
- Treating a high yield as cheap. Very high yields usually reflect a market view that the cash flow will fall. The yield is high because the price is low, and the price is low for a reason.
- Forgetting growth. A 6% yield growing at 8% is worth far more than a 9% yield shrinking at 3%.
- Using a single year. Capital expenditure is lumpy. Average across a cycle where you can.
Frequently Asked Questions
What is a good free cash flow yield?
Why use free cash flow rather than earnings?
What does the enterprise value yield tell me?
What is cash conversion?
Is earnings yield really just one over the PE?
Why might a very high yield be a bad sign?
Sources
- U.S. Securities and Exchange Commission, Investor.gov, the official authority for the investing this calculator relates to. investor.gov
Also consulted: Standard valuation mathematics. Free cash flow yield, earnings yield, enterprise value and the price to book and price to sales multiples carry no jurisdictional content; The identity that earnings yield is the reciprocal of the PE ratio is asserted directly in the engine vectors.