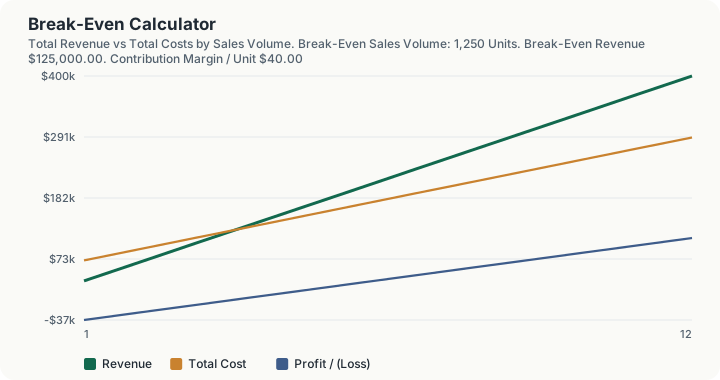
Quick Answer: Enter your fixed costs, price per unit, and variable cost per unit to find the exact number of units and dollars in revenue you need to sell before your business stops losing money and starts turning a profit.
Overview
The break-even point is the single most useful number in small business math, and it is also the number most owners never actually calculate. It answers one question with no ambiguity: how many units of your product or service do you have to sell in a given period before every dollar of fixed overhead is covered and the next sale becomes profit? Below that line, you are funding the business out of savings or a loan. Above it, you are running a business that pays for itself.
This calculator is built for people who are pricing a new product, evaluating whether a location or a piece of equipment is worth the fixed cost it adds, or sanity-checking a sales forecast against reality. It takes four inputs, total fixed operating costs, the price you charge per unit, the variable cost to produce or deliver each unit, and your projected unit sales, and returns the break-even volume in both units and revenue, plus a margin of safety that tells you how much cushion you have if sales come in soft.
Unlike a general profitability calculator, this tool is deliberately narrow: it assumes a single product or a blended average price and cost across your product mix, and it assumes fixed costs stay fixed across the volume range you are testing. That narrowness is what makes the math exact and the output actionable rather than a vague range.
How This Is Calculated
The calculator runs on the classic cost-volume-profit (CVP) formula. Contribution margin per unit is the selling price minus the variable cost per unit, the amount each sale contributes toward covering fixed costs before anything is left over as profit:
Contribution Margin per Unit = Selling Price − Variable Cost per Unit
Break-even in units is fixed costs divided by that contribution margin, rounded up to the next whole unit since you cannot sell a fraction of a unit and still cover the last dollar of overhead:
Break-Even Units = Fixed Costs ÷ Contribution Margin per Unit
Break-even revenue restates that same point in dollars using the contribution margin ratio (contribution margin per unit divided by price):
Break-Even Revenue = Fixed Costs ÷ Contribution Margin Ratio
From there, the engine projects revenue, total cost, and profit at your forecasted unit sales, and computes margin of safety, the percentage by which projected sales exceed the break-even point:
Margin of Safety % = (Projected Revenue − Break-Even Revenue) ÷ Projected Revenue
If your selling price is at or below your variable cost per unit, no volume of sales will ever break even; the calculator detects this guard condition and reports "N/A" rather than a misleading negative or infinite unit count. All arithmetic runs through the breakeven primitive using Decimal.js arbitrary-precision math, so there is no floating-point drift when scaling to large production volumes.
Worked Example
A workshop making a single $100 product carries $50,000 of fixed overhead a year and spends $60 in materials and direct labour on each unit. The owner wants one number: how many must go out of the door before the year stops costing money.
Step 1 -- Contribution margin per unit. $100 price - $60 variable cost = $40
That $40 is what each sale contributes to overhead. It is not profit until overhead is covered.
Step 2 -- Contribution margin ratio. $40 / $100 = 40.0%
Step 3 -- Break-even in units. $50,000 fixed costs / $40 per unit = 1,250 units
Step 4 -- Break-even in revenue. $50,000 / 0.40 = $125,000
Step 5 -- Revenue at the projected 2,000 units. 2,000 x $100 = $200,000
Step 6 -- Total cost at 2,000 units. $50,000 + (2,000 x $60) = $170,000
Step 7 -- Projected profit. $200,000 - $170,000 = $30,000
Step 8 -- Margin of safety in units. 2,000 - 1,250 = 750 units of cushion
Step 9 -- Margin of safety as a percentage. ($200,000 - $125,000) / $200,000 = 37.5%
Step 10 -- Markup on cost. ($100 - $60) / $60 = 66.7%
The useful reading is steps 3 and 9 together. The first 1,250 units of the year earn nothing at all -- they are buying back the overhead -- and only from unit 1,251 does the $40 margin start dropping to the bottom line. That is why the last 750 units generate the entire $30,000 profit. It also explains the asymmetry that catches owners out: a 10% shortfall in volume does not cut profit by 10%, it cuts it by $20,000, or two thirds, because fixed costs do not shrink with the order book.
What This Does Not Account For
- Multiple products with different margins. This tool assumes one price and one variable cost. If your business sells a mix of high-margin and low-margin items, you need a weighted-average contribution margin across your actual sales mix, not a single product's numbers.
- Step-fixed costs. Real fixed costs are rarely fixed forever; hire a second shift or lease more warehouse space past a certain volume and your "fixed" cost jumps to a new, higher plateau. This calculator holds fixed costs constant across the entire range.
- Taxes. Break-even is calculated on pre-tax operating profit. Income taxes on that profit are not deducted.
- Non-linear variable costs. Bulk purchasing discounts, labor overtime premiums, and rush shipping fees can make true variable cost per unit shift with volume rather than stay constant.
- Timing and cash flow. Break-even measures a static volume threshold, not when in the calendar year you will actually cross it, and it ignores the cash timing gap between when you pay costs and when customers pay you.
Common Pitfalls
- Misclassifying costs. The most common error is putting a semi-variable cost, like a phone bill with a base fee plus per-minute charges, entirely into "fixed" or entirely into "variable." Split it, or your break-even point will be wrong in a way that is hard to detect.
- Using gross revenue price instead of net price. If you sell through a marketplace or distributor that takes a commission, your effective price per unit is lower than your list price. Enter the net amount you actually keep.
- Forgetting returns, discounts, and allowances. If 5% of units get returned or sold at a discount, your effective price per unit is lower than the sticker price you might otherwise enter.
- Treating break-even as a target instead of a floor. Break-even is the point where profit equals zero, not a goal. Businesses that plan to operate exactly at break-even have no cushion for a slow month.
- Ignoring the margin of safety. A business sitting right at its break-even point is more fragile than one with the same profit but a wider gap between projected and break-even sales; margin of safety is what tells you how much bad luck you can absorb.
Frequently Asked Questions
What is the difference between contribution margin and gross margin?
Why does the calculator round break-even units up instead of down?
What does it mean if my break-even result shows "N/A"?
How is margin of safety different from profit margin?
Should I use monthly or annual figures?
Sources
- U.S. Small Business Administration, "Break-Even Analysis" guidance for business plan financial projections. sba.gov
Also consulted: Financial Accounting Standards Board (FASB), Accounting Standards Codification on cost classification (fixed vs. variable); SCORE (Service Corps of Retired Executives), Cost-Volume-Profit Analysis worksheets for small business planning; Corporate Finance Institute, contribution margin and break-even analysis methodology references.