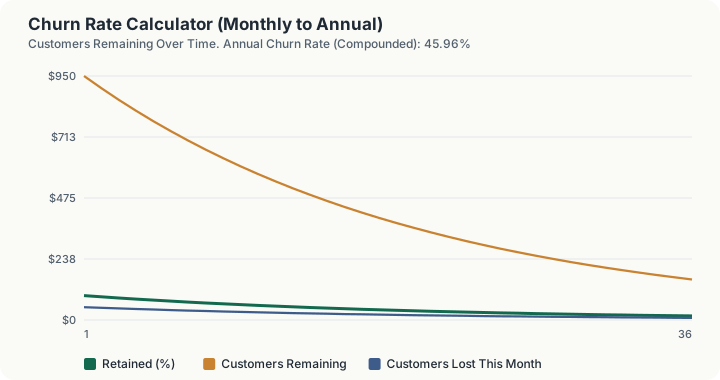
Quick Answer: At 5% monthly churn the compounded annual churn rate is 45.96%, not the 60% you get by multiplying by twelve. The additive intuition overstates the real annual loss by 14.04 percentage points, because each month's 5% is taken from a base that has already shrunk. Annual customer retention is 54.04%, average customer lifetime is 20.0 months, and the cohort half-life is 13.5 months.
What does this calculator do?
Churn compounds. It does not add. This is the single most consequential arithmetic error in subscription businesses, and it runs in the direction that makes things look worse than they are, which is why nobody catches it: a 5% monthly churn rate feels like it should mean 60% of customers gone in a year, and the real figure is 45.96%.
The reason is that the second month's churn applies to the 95% who survived the first month, not to the original 100. By month twelve the base has shrunk substantially, and each successive month's 5% removes fewer customers in absolute terms than the one before. Survival after twelve months is 0.95 raised to the twelfth power, which is 0.5404, so 54.04% remain and 45.96% have gone.
The error becomes absurd rather than merely wrong at higher rates. At 15% monthly churn, multiplying by twelve gives 180%, which would require more customers to leave than ever existed. The compounded figure is 85.78%.
This calculator also separates three retention measures that are routinely conflated: logo churn (customers), gross revenue retention (revenue lost) and net revenue retention (revenue lost, offset by expansion from the customers who stayed). They can point in opposite directions, and a business with brutal logo churn can still show net revenue retention above 100%.
How is this calculated?
annual churn = 1 − (1 − m)¹²
average lifetime = 1/m; half-life = ln 0.5/(ln(1 − m))
GRR_monthly = 1 − m − c; NRR_monthly = 1 − m − c + e
where $m$ is monthly logo churn, $c$ is monthly contraction and $e$ is monthly expansion, each expressed as a fraction.
Step 1: Convert the monthly churn rate to a monthly survival rate. 1 - 0.05 = 0.95
Step 2: Compound the survival rate over twelve months. 0.95^12 = 0.5404, that is 54.04% annual retention
Step 3: Subtract from one to get annual churn. 1 - 0.5404 = 0.4596, that is 45.96%
Step 4: Compute the naive figure for comparison. 0.05 x 12 = 60.00%
Step 5: Measure the gap. 60.00% - 45.96% = 14.04 percentage points of overstatement
Step 6: Average customer lifetime. 1 / 0.05 = 20.0 months
This is the expectation of a geometric distribution under a constant monthly hazard rate, and it is the reason the textbook lifetime value formula is ARPU divided by churn.
Step 7: Cohort half-life. ln(0.5) / ln(0.95) = -0.6931 / -0.0513 = 13.5 months
Half-life is shorter than average lifetime, and always is. The average is dragged upward by a long surviving tail; the half-life is the point at which half the cohort has already gone.
Step 8: Gross revenue retention, monthly. 1 - 0.05 - 0.01 = 94.00%
Losses only: logo churn plus contraction from downgrades. Gross revenue retention can never exceed 100%.
Step 9: Net revenue retention, monthly. 94.00% + 9.00% = 103.00%
Expansion revenue from the customers who stayed is credited back on top.
Step 10: Net revenue retention, annual. 1.03^12 = 142.58%
This is the monthly net revenue retention rate compounded twelve times, not a separately measured annual cohort figure.
Worked Example
A cohort of 1,000 customers with 5% monthly churn, 9% monthly expansion and 1% monthly contraction.
Step 1: Month one. 1,000 x 0.95 = 950 customers remaining, 50 lost.
Step 2: Month two. 950 x 0.95 = 902.5 customers remaining. Note that only 47.5 were lost this month, not 50. The base shrank, so the same rate removed fewer people.
Step 3: Month three. 902.5 x 0.95 = 857.4 customers remaining, 45.1 lost.
Step 4: Month twelve. 1,000 x 0.95^12 = 540.4 customers remaining.
Step 5: Customers actually lost in the year. 1,000 - 540.4 = 459.6, which is 45.96% of the starting cohort.
Step 6: What the additive intuition predicted. 1,000 x 0.60 = 600 lost. It overstates the loss by 140.4 customers, a forecasting error of more than 14% of the entire cohort.
Step 7: Half the cohort is gone at month 13.5, well before the 20-month average lifetime, because the tail of long-lived survivors pulls the average up.
Step 8: Revenue tells a different story. Gross revenue retention is 94.00% a month: churn and downgrades together take 6% of revenue. But 9% of expansion from the survivors more than covers it, so net revenue retention is 103.00% monthly and 142.58% annualised. Revenue grows without a single new customer, while 45.96% of the logos leave. Both statements are true at once, and reporting only one of them is how a business misleads itself.
The Second Year of the Same Cohort
Step 4 stops at month twelve, which is where most retention reporting stops too. The cohort does not.
Step 9: Month 13. 513.3 customers remaining, cumulative losses 486.7.
Step 10: Month 24. 292.0 remaining, cumulative losses 708.0.
Step 11: Losses in the second year alone. 540.4 - 292.0 = 248.4 customers, against 459.6 in the first year.
Step 12: Month 36. 157.8 remaining, cumulative losses 842.2, or 84.2% of the original cohort.
The second year costs 248.4 customers where the first cost 459.6, and the third costs only 134.2 more. That deceleration is the same compounding as step 2, seen from far enough away to matter for planning: a constant 5% monthly rate destroys nearly half the cohort in year one and takes three full years to reach 84%. Acquisition has to replace 459.6 customers in the first year to stand still and only 248.4 in the second, so a business that sizes its sales target off year-one losses will overbuild, and one that sizes it off the surviving cohort will underbuild.
What does this calculator not account for?
- It assumes a constant monthly hazard rate. Real churn is heavily front-loaded: customers who cancel in month one behave nothing like those who reach month eighteen. A single constant rate flattens that curve, and the average lifetime figure of 1/m is only true under the constant-hazard assumption.
- It does not segment. One blended churn rate across plans, cohorts, channels and contract lengths hides the fact that annual contracts and monthly contracts churn on entirely different clocks.
- Expansion and contraction are entered as flat monthly percentages of starting MRR. In reality expansion is lumpy, concentrated in a minority of accounts and often tied to renewal dates rather than distributed evenly.
- No distinction between voluntary and involuntary churn. Failed payments and expired cards are a different problem from customers who chose to leave, and they respond to different fixes.
- No reactivation or win-back. A customer who leaves and returns is treated here as gone.
- The annual net revenue retention figure is the monthly rate compounded, not a measurement of a real annual cohort. If your monthly expansion rate is not actually stable, the annualised figure will not match what you observe.
- No benchmarks. There is no authoritative source for what churn rate is normal in any industry.
What mistakes do people make with this?
- Multiplying monthly churn by twelve. The error is always in the same direction and it grows with the rate. Above roughly 8.4% monthly the naive figure exceeds 100%, which should be the tell.
- Dividing annual churn by twelve to get monthly. The inverse of the same mistake. The correct conversion is the twelfth root: monthly = 1 - (1 - annual)^(1/12).
- Reading net revenue retention as a customer measure. Net revenue retention above 100% says nothing about whether customers are staying. It says the customers who stayed are spending more. A business can lose half its logos and still report expanding revenue.
- Quoting average lifetime as though it were typical. With 5% monthly churn the average lifetime is 20 months but half the cohort is gone in 13.5. The mean is not the median and the gap widens as churn falls.
- Mixing the denominator. Churn measured against starting customers, average customers over the period, and customers available to renew all give different numbers. Pick one and hold it constant, or the trend line is meaningless.
- Comparing gross and net retention as though they were rivals. Gross revenue retention is a measure of leakage and can never exceed 100%. Net revenue retention includes growth from the existing base. Both are needed; neither substitutes for the other.
Frequently Asked Questions
Why is annual churn 45.96% and not 60% at a 5% monthly rate?
How do I convert an annual churn rate back to a monthly one?
What is the difference between customer churn and revenue churn?
Can net revenue retention really be above 100% while nearly half my customers leave?
Why is half-life shorter than average customer lifetime?
Sources
- U.S. Small Business Administration, the official authority for the business this calculator relates to. sba.gov
Also consulted: Compounding: survival over twelve months is (1 − m)¹², so annual churn is $1-(1-m)^{12}$. The inverse conversion uses the twelfth root; Expected lifetime: under a constant monthly hazard rate $m$, the number of months a customer survives follows a geometric distribution whose expectation is $1/m$; Half-life: solving (1 − m)^h = 0.5 gives h = ln(0.5)/ ln(1 − m).
No authority publishes churn benchmarks, and none is cited here, because none exists. There is no government, regulatory or standards body that defines a churn rate, publishes normal ranges by industry, or sets a methodology for measuring it. Vendor and investor surveys circulate figures, but they use inconsistent definitions and unaudited samples, and they are not primary sources. The default inputs in this calculator (5% monthly churn, 9% expansion, 1% contraction) are illustrative values chosen to demonstrate the arithmetic, not benchmarks. What is not a matter of opinion is the mathematics: These are standard results and they are what the engine implements.