Quick Answer: A $1,200,000 property collecting $10,000 a month has a gross rent multiplier of 10.0: the price divided by $120,000 of gross annual income. At 5% vacancy and a 35% operating expense ratio, that same GRM sits on a 6.175% cap rate. Against a market GRM of 8.5 the asking price is $180,000 above what comparables imply, and the rent would have to reach $11,764.71 a month to justify it.
What does this calculator do?
GRM = price/(gross annual rent)
It is the crudest screening metric in real estate, and it is useful precisely because it is crude. It needs two numbers a listing always states, and no expense figures a seller might shade. You can compute it on a phone in a parking lot.
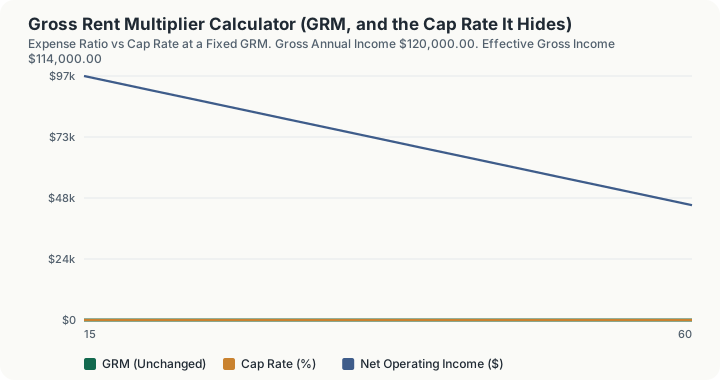
What it cannot see is the entire expense side, and the relationship is exact rather than approximate:
cap rate = ((1 − v)(1 − OER))/GRM
Two buildings at an identical GRM of 10 can carry very different cap rates. At a 35% expense ratio this property yields 6.175%. At a 55% expense ratio, with the identical price and the identical rent roll, it yields 4.275%. The multiple cannot distinguish them. A GRM comparison between two properties is only valid when their vacancy and expense ratios match, and that condition is almost never stated when the metric is quoted.
The second weakness is sensitivity. GRM moves fast on small rent changes, which is why a seller quoting pro-forma rather than actual rents can quote a flattering multiple. On this property, $100 a month of extra rent per unit-equivalent pulls the GRM from 10.0 to 9.9 with no change to the price.
How is this calculated?
Step 1: Build gross monthly income. Scheduled rent at full occupancy, plus any other monthly income such as parking, laundry, storage or pet rent. Ancillary income counts toward gross income, so it lowers the GRM.
Step 2: Annualise it. Multiply by twelve.
Step 3: Compute the GRM. Price divided by gross annual income.
Step 4: Compute the gross rent yield as the reciprocal of the GRM expressed as a percentage. It is the same fact stated the other way up.
Step 5: Compute the vacancy and credit loss as the vacancy rate applied to gross annual income. GRM itself ignores this entirely; it is used here only to derive the cap rate underneath.
Step 6: Compute effective gross income as gross annual income less that loss.
Step 7: Compute operating expenses as the expense ratio applied to effective gross income. Debt service is excluded, as it always is from an operating expense ratio.
Step 8: Compute net operating income as effective gross income less operating expenses.
Step 9: Compute the cap rate directly as net operating income divided by price.
Step 10: Compute the cap rate implied by the GRM identity as (1 − v)(1 − OER)/ GRM. It matches step 9 exactly, because it is the same equation rearranged, and seeing them agree is what makes the identity trustworthy.
Step 11: Value the property at the market GRM by multiplying the comparable-derived GRM by gross annual income, and compare against the asking price.
Step 12: Solve for the rent that would justify the asking price at the market GRM.
Step 13: Recompute the GRM after $100 a month of extra rent, to show how fast the metric moves.
Worked Example
$1,200,000 asking price, $10,000 a month of rent, no ancillary income, 5% vacancy, 35% expense ratio, market GRM of 8.5 from comparables.
Step 1: Gross monthly income. $10,000 + $0 = $10,000
Step 2: Gross annual income. $10,000 x 12 = $120,000
Step 3: Gross rent multiplier. $1,200,000 / $120,000 = 10.0
Step 4: Gross rent yield. 1 / 10.0 = 10.00%
Step 5: Vacancy and credit loss at 5%. $120,000 x 5% = $6,000
Step 6: Effective gross income. $120,000 - $6,000 = $114,000
Step 7: Operating expenses at 35% of effective gross income. $114,000 x 35% = $39,900
Step 8: Net operating income. $114,000 - $39,900 = $74,100
Step 9: Cap rate. $74,100 / $1,200,000 = 6.175%
Step 10: Cap rate from the GRM identity. (1 - 0.05) x (1 - 0.35) / 10.0 = 0.95 x 0.65 / 10.0 = 6.175%
The two agree to the last digit, which is the point: the identity is exact.
Step 11: Value at the market GRM of 8.5. 8.5 x $120,000 = $1,020,000
Step 12: Price versus market. $1,020,000 - $1,200,000 = -$180,000
The asking price sits above what the market GRM implies for this rent roll. Either the rents are below market, or the price is.
Step 13: Rent needed to justify the asking price at a GRM of 8.5. $1,200,000 / 8.5 = $141,176.47 a year $141,176.47 / 12 = $11,764.71 a month
Step 14: GRM after a $100 a month rent rise. $120,000 + $1,200 = $121,200 $1,200,000 / $121,200 = 9.90
A 1% rent increase moved the multiple by a full tenth. That is the sensitivity a pro-forma rent roll exploits.
What does this calculator not account for?
- GRM ignores every expense, by construction. The vacancy rate and expense ratio on this page are used only to derive the cap rate alongside it; they play no part in the multiplier itself.
- The expense ratio is a single assumed percentage, not a schedule. Real operating expenses are a stack of taxes, insurance, management, utilities, turnover, repairs and reserves, and the ratio moves with building age, unit mix and who pays the utilities.
- No capital expenditure reserve is deducted. Net operating income here follows the standard convention of excluding reserves for roof, boiler and turnover capital, which means the cap rate shown is the conventional one, not an economic one.
- No debt service, and therefore no cash-on-cash return, leverage or debt service coverage ratio. Cap rate is by definition an unlevered measure.
- No tax. Depreciation, deductibility and the tax profile of the buyer are all absent.
- No growth, no exit. This is a single-year snapshot. Rent growth, expense inflation, lease-up and terminal value all sit outside it.
- The market GRM is your input. Nothing here validates it against actual comparable sales, and a market GRM drawn from properties with a different expense profile is not comparable to this one.
- Scheduled rent, not collected rent. Gross income is taken at full occupancy. Concessions, below-market legacy leases and bad debt beyond the vacancy allowance are not modelled.
What mistakes do people make with this?
Comparing GRMs across buildings with different expense profiles. This is the fundamental error. Identical multiples on a 35% and a 55% expense ratio building are 6.175% and 4.275% cap rates. Nearly two full points of yield, entirely invisible to the metric.
Accepting a pro-forma rent roll. GRM is the price divided by rent, so overstating rent understates the multiple. Insist on trailing twelve-month collected rent and check it against the rent roll and bank deposits.
Forgetting ancillary income. Parking, laundry and storage count toward gross income. Adding $800 a month of ancillary income to this property pulls the GRM from 10.0 to about 9.26 with no change to the rent roll at all. If a seller's GRM includes it and yours does not, you are not comparing the same number.
Using GRM as a valuation. It is a screen. It tells you which listings deserve twenty minutes of underwriting and which do not. Buying on a GRM is buying on an assumption about expenses you have not verified.
Mixing monthly and annual GRM. Some markets quote a monthly multiplier (price divided by monthly rent), which is twelve times larger. A GRM of 10 and a GRM of 120 can describe the identical property.
Reading a low GRM as a bargain. A low multiple often signals high expenses, weak rents that are actually at market, or a location the comparables do not cover. Check the cap rate underneath it before congratulating yourself.
Frequently Asked Questions
What is a good gross rent multiplier?
How does GRM relate to cap rate?
Should I include vacancy in the GRM?
Why did the GRM barely move when I changed the expense ratio?
Does other income lower or raise the GRM?
Can I use GRM on a single-family rental?
Sources
Also consulted: Gross rent multiplier: price divided by gross annual rent. Implemented in engine/primitives/ratios.ts and applied by engine/primitives/gross-rent-multiplier.ts; Capitalisation rate: net operating income divided by price, with net operating income taken as effective gross income less operating expenses, excluding debt service and capital reserves, in the conventional definition; The GRM to cap rate identity: cap rate equals (1 − vacancy)(1 − operating expense ratio) divided by GRM. This is an algebraic identity, not an approximation, and the engine verifies it by computing the cap rate both ways and comparing.
This calculator contains no statutory data. It applies standard income-property relationships: The market GRM against which the subject is priced is supplied by you from comparable sales, because no published national figure could be meaningful across submarkets.