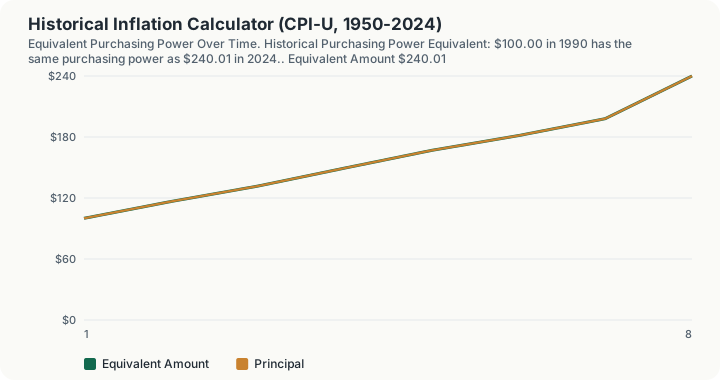
Quick Answer: $100 in 1990 has the same purchasing power as $240.01 in 2024, meaning prices roughly 2.4x'd over that 34-year span, based on official BLS CPI-U annual average index values (130.7 in 1990, 313.689 in 2024).
Overview
This calculator answers a genuinely historical question: given a dollar amount from a past year, what is the equivalent amount today, or in any other year, based on how much broad consumer prices actually changed between those two points. It is the mirror image of a forward-looking inflation projection calculator, which assumes a future inflation rate and compounds it forward from today. This calculator uses no assumptions at all. Every conversion runs on real, published Consumer Price Index for All Urban Consumers (CPI-U) annual average index values from the U.S. Bureau of Labor Statistics, the same government data series that underlies cost-of-living adjustments, Social Security benefit increases, and most economic inflation reporting in the United States.
The data covers 1950 through 2024, 75 years of annual average CPI-U index values (series CUUR0000SA0, 1982-84=100 base), sourced directly from BLS's own historical CPI-U reference table and cross-checked against two independent secondary compilations with exact agreement across all 75 years. The range stops at 2024, not because more recent data doesn't exist, but because it doesn't fully exist yet in finalized form: BLS did not collect CPI source data for October and November 2025 due to the 2025 lapse in appropriations (a government shutdown), so there is no complete, officially finalized 12-month annual average for 2025 as of this calculator's verification date. Rather than publish an estimated or partial-year figure as if it were a finalized government statistic, this calculator uses 2024, the most recent calendar year with a clean, complete, official annual average, as its most-current reference point.
How This Is Calculated
The calculation is the standard method the BLS itself uses for its own CPI Inflation Calculator: a straight ratio of the two years' index values applied to your dollar amount.
Each year's CPI-U value in the underlying data table is the annual average of that year's twelve published monthly index readings, not a single month's snapshot. This smooths out seasonal and month-to-month noise, which is the standard approach for year-over-year historical comparisons. The calculator works equally well in either direction: converting an older amount forward to a more recent year's equivalent, or converting a more recent amount backward to show what it would have been worth in an earlier year. Both directions use the identical ratio, just with the source and target years swapped, and the "Purchasing Power Ratio" output shows exactly which multiple (or fraction) connects the two years.
Worked Example
The conversion itself is one ratio, but the intermediate years are where the shape of the answer lives, so each example is carried through the decades rather than jumped end to end.
$100 from 1990 to 2024
Step 1 -- The two index values. CPI-U 1990 annual average: 130.700 CPI-U 2024 annual average: 313.689
Step 2 -- The purchasing power ratio. 313.689 / 130.700 = 2.4001x
Step 3 -- Apply it to the amount. $100.00 x 2.4001 = $240.01
Step 4 -- Cumulative inflation over the span. 2.4001 - 1 = 140.0%
Step 5 -- The same $100 at five-year checkpoints. 1995 (CPI 152.400): $116.60 2000 (CPI 172.200): $131.75 2005 (CPI 195.300): $149.43
Step 6 -- The second half of the span. 2010 (CPI 218.056): $166.84 2015 (CPI 237.017): $181.34 2020 (CPI 258.811): $198.02
Step 7 -- The last four years. 2024: $240.01
Step 7 is worth pausing on. The 1990 dollar took thirty years to reach $198.02 and then added $41.99 more in four, so about 30% of the entire $140.01 increase happened in the 2020 to 2024 window. A single ratio hides that; the checkpoints do not.
$1 from 1970 to 2024
Step 8 -- The ratio across 54 years. 313.689 / 38.800 = 8.0848x $1.00 becomes $8.08, a cumulative 708.5%
Step 9 -- Decade by decade. 1980 (CPI 82.400): $2.12 1990 (CPI 130.700): $3.37 2000 (CPI 172.200): $4.44 2010 (CPI 218.056): $5.62 2020 (CPI 258.811): $6.67 2024: $8.08
The 1970s alone more than doubled the figure, from $1.00 to $2.12, a 2.12x multiple in ten years. The thirty years from 1990 to 2020 managed only 1.98x, from $3.37 to $6.67. Compounding does not distribute evenly across a long span, and averaging an annual rate over five decades badly misrepresents where the erosion actually occurred.
$500 from 2024 back to 1980
Step 10 -- The ratio, source and target swapped. 82.400 / 313.689 = 0.2627x
Step 11 -- The equivalent amount. $500.00 x 0.2627 = $131.34
Step 12 -- Reading the backward direction. The calculator reports this as 73.7% cumulative deflation in nominal terms from 2024 back to 1980
Step 13 -- Intermediate checkpoints going back. 2014 (CPI 236.736): $377.34 2004 (CPI 188.900): $301.09 1994 (CPI 148.200): $236.22 1984 (CPI 103.900): $165.61 1980: $131.34
A ratio above 1.0000x means the target year had the higher prices, and a ratio below it means the reverse. Step 10 is simply the 1980 to 2024 ratio turned upside down: dividing 313.689 by 82.400 instead gives 3.8069x, and 0.2627 is its reciprocal. The backward figure is expressed as a fall in nominal terms rather than as deflation the economy actually experienced.
Reading the Purchasing Power Ratio
The ratio output is the same CPI(target)/CPI(source) fraction used in the core formula, expressed as a multiplier. A ratio above 1.0000x means the target year had higher prices than the source year (the typical case when converting an older amount forward to today); a ratio below 1.0000x means the target year had lower prices (the case when converting a recent amount backward to an earlier year). A ratio of exactly 1.0000x means the two years are identical, which happens whenever the source and target year inputs match. This ratio is useful on its own for a quick "how many times higher/lower" comparison without needing to think in dollar terms at all, and it's the same figure economists cite when they say something like "prices have roughly tripled since 1990."
What This Does Not Account For
CPI-U is a broad, national, all-items average across a representative basket of goods and services purchased by urban consumers; it does not reflect your personal spending mix, which may have inflated faster or slower than the national average depending on how much of your budget goes to categories like housing, healthcare, or energy that have historically outpaced or lagged the all-items index. It does not account for regional cost-of-living differences; CPI-U is a national figure, and prices in a specific metro area can diverge meaningfully from the national trend in any given year. It is not the same series as CPI-W (used for Social Security COLA calculations) or the Chained CPI-U (C-CPI-U, used for certain federal tax bracket indexing since 2018); those series use different weighting methodologies and will produce slightly different equivalent-value figures for the same years. It does not project inflation forward from 2024 to today's date; for that, use this platform's forward-looking inflation projection calculator instead, which is a fundamentally different question requiring an assumed future rate rather than published historical data. It also does not include 2025 or 2026, for the data-availability reasons explained above.
Common Pitfalls
A common misreading is treating "purchasing power" as identical to "value" in every sense; CPI adjusts for the changing price of a fixed basket of consumer goods, not for changes in quality, availability, or what a dollar could theoretically buy in an investment sense. A dollar invested in 1990 and left in a diversified stock portfolio would have grown to a very different figure than its CPI-adjusted purchasing-power equivalent, because investment returns and consumer price inflation are entirely different phenomena being confused for each other. Another pitfall is applying a general CPI-U conversion to a category that has inflated dramatically differently from the all-items average, most notably healthcare, higher education, and housing, all of which have outpaced headline CPI-U for extended stretches; a general inflation calculator will understate the real cost increase for those specific categories. It's also easy to misinterpret a backward conversion; "$500 today equals $131 in 1980" does not mean $500 was somehow worth less in 2024, it means the same purchasing power that $500 buys today would have required only $131 in 1980, because prices were lower then.
Frequently Asked Questions
Why does the data stop at 2024 instead of including 2025 or the current year?
What's the difference between this calculator and a general inflation calculator that projects forward?
Is CPI-U the same thing as "the inflation rate"?
Why is my $100 from a specific month different from what this calculator shows?
Can I use this to figure out how much my salary from a past year would need to be today just to keep pace with inflation?
Sources
- U.S. Bureau of Labor Statistics, Historical Consumer Price Index for All Urban Consumers (CPI-U), U.S. city average, all items, annual average, series CUUR0000SA0 (1982-84=100 base). bls.gov/cpi
- Board of Governors of the Federal Reserve System, the official authority for the inflation this calculator relates to. federalreserve.gov
Also consulted: U.S. Bureau of Labor Statistics, "Consumer Price Index News Release," December 2025 results, noting October and November 2025 data are unavailable due to the 2025 lapse in appropriations; Cross-checked against independent CPI-U historical compilations at cpichart.com and usinflationcalculator.com, with exact year-by-year agreement across the full 1950-2024 range, and independently recomputed for 2023 and 2024 directly from published monthly index values.