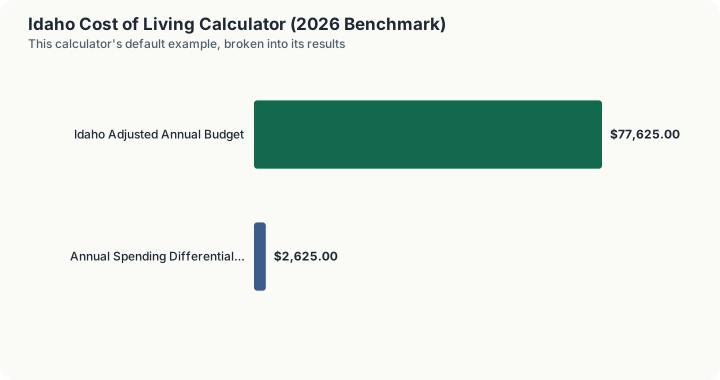
Quick Answer: Idaho's cost of living is 3.5% above the U.S. national average (composite index 103.5), so a $75,000.00 national-average household budget costs about $77,625.00 a year in Idaho.
Idaho's 103.5 and Its Housing Problem
Idaho's composite index is 103.5, only 3.5% above the national baseline, ranking #19 of 50. But that mild composite is the average of two categories pulling hard in opposite directions, and understanding why is the whole point of budgeting for Idaho.
Housing: 115.6. Utilities: 88.5. A 27-point spread inside one state.
Why housing sits 12 points above the composite
The answer is Boise. Ada County and the surrounding Treasure Valley (Meridian, Nampa, Eagle, Kuna) absorbed one of the most concentrated in-migration surges in the country during and after the pandemic, drawing remote workers and relocating households principally from California and Washington. Those arrivals brought coastal-market equity and coastal-market incomes into a metro whose housing stock had been built for a far smaller and far cheaper market. Prices repriced upward faster than local wages did, and Boise spent much of that period near the top of national home-price-appreciation rankings.
The consequence for this page's numbers is direct: Idaho's 115.6 housing index is not a statewide condition, it is largely a Treasure Valley condition averaged into a statewide figure. Housing in Idaho Falls, Pocatello, Twin Falls, or Lewiston is materially cheaper than in Eagle or downtown Boise. A household that maps the 115.6 onto rural southeastern Idaho will overstate its costs; a household that maps the 103.5 composite onto a Boise home search will badly understate them. This is the single most important adjustment a prospective Idaho mover has to make, and it is why the composite alone is a poor planning tool here.
Why utilities sit 15 points below the composite
Hydroelectricity. Idaho's power supply is dominated by hydro generation on the Snake River, most prominently the Hells Canyon Complex (Brownlee, Oxbow, and Hells Canyon dams) on the Snake at the Oregon border, plus a chain of mid-Snake plants across the Snake River Plain. Hydro has essentially no fuel cost once the dams are built, and the resulting residential electricity rates are consistently among the lowest in the United States. A relatively dry, temperate Snake River Plain climate keeps consumption moderate on top of cheap rates. The result is an 88.5 utilities index, a genuine, structural, geography-driven discount that partially offsets Treasure Valley housing costs and does apply statewide.
Idaho's tax profile reinforces the housing story rather than offsetting it: the effective property tax rate is roughly 0.43% (ranked 47th, among the lowest in the nation), helped by the homeowner's exemption on owner-occupied primary residences. Low annual carrying cost is part of what made Boise attractive to equity-rich arrivals in the first place. Sales tax is 6% statewide with almost no local add-on (resort-city local option taxes in places like Sun Valley and McCall are the narrow exception), averaging about 6.03% combined.
Put in dollars, a $75,000 national-average budget shifts by about $2,625 once relocated to Idaho. The composite index is broader than the three components shown here: it also incorporates transportation, healthcare, and miscellaneous spending that MERIC does not break out by state individually.
Key Index Components for Idaho:
- Composite Benchmark Index: 103.5 (Rank #19)
- Housing Cost Index: 115.6
- Utilities Cost Index: 88.5
- Grocery Cost Index: 99.4
How This Is Calculated
Idaho's composite of 103.5 is a truce between two categories pulling hard against each other. Housing reads 115.6, driven by the Boise and Treasure Valley market, while utilities are 88.5, the lowest utilities index of any state in the table. Groceries sit at 99.4, essentially at parity. The calculator applies the netted composite, not either extreme.
- Baseline budget. You enter annual household spending priced at the national benchmark, index 100.0.
- Composite lookup. Idaho's composite index of 103.5 is read from the 2026 MERIC state table, along with its rank of #19 among the 50 states.
- Single-factor scaling. The baseline is multiplied by 103.5 and divided by 100. Housing 115.6, groceries 99.4 and utilities 88.5 are shown for context and are not separately weighted, since MERIC's composite already does that. Given a 27-point spread between the housing and utility figures, a household heavily weighted toward housing should treat 103.5 as a floor rather than an estimate.
- Differential. The dollar and percentage difference against the baseline is taken from the scaled result, which is what the headline output and the monthly view report.
Worked Example
Using this calculator's baseline scenario: a household needing $75,000.00 a year to sustain a standard basket of goods (housing, groceries, utilities, transportation, and healthcare), priced at the U.S. national average (composite index 100.0).
- National baseline. $75,000.00 is the reference spending level at the national-average price level (index 100.0).
- Apply Idaho's composite index. Idaho's composite index of 103.5 (rank #19 nationally) means local prices run 3.5% above the national basket. Scaling: $75,000.00 × (103.5 ÷ 100) = $77,625.00.
- Dollar differential. $77,625.00 − $75,000.00 = +$2,625.00, so a household living in Idaho needs its budget to grow by that amount to match the same standard of living.
- Percentage and monthly view. That is +3.5% of the baseline, or $6,468.75/mo in Idaho versus $6,250.00/mo nationally.
The modest +3.5% headline conceals the real structure: housing at 115.6 pushes the budget up, cheap hydro-backed utilities at 88.5 pull it back down, and the two nearly cancel. A Boise household weighted toward rent or mortgage will not experience the cancellation.
Idaho's Category Table, and the Reverse Calculation
Unlike most state pages in this family, this calculator emits a genuine per-category breakdown rather than a loan-shaped schedule, so the four indices can be read against each other directly. What it still does not do is weight them.
What the breakdown returns on the $75,000 baseline. The composite at 103.5 gives $77,625.00 and a differential of $2,625.00. Housing at 115.6 gives $86,700.00, a differential of $11,700.00. Groceries at 99.4 gives $74,550.00, a differential of minus $450.00. Utilities at 88.5 gives $66,375.00, a differential of minus $8,625.00. Each of those four figures is your whole budget priced as though it were entirely that one category. None of them is a component of the headline, and adding them together is meaningless.
One factor drives the headline. The $77,625.00 result is your budget multiplied by 103.5 and divided by 100, full stop. The engine does not apportion spending across the four categories or weight them, so a household whose spending skews towards Idaho housing at 115.6 and away from utilities at 88.5 gets the same answer as one with the opposite mix. The breakdown table exists to show you the spread, not to change the result.
The marginal figure. Each additional $1,000 of national-baseline spending costs $1,035.00 in Idaho. The engine returns $78,660.00 on a $76,000 baseline against $77,625.00 on $75,000. At the $120,000 family scenario Idaho returns $124,200.00.
The reverse question. A household spending $75,000 a year in Idaho is living a national-average lifestyle worth $72,463.77: enter that baseline and the engine returns exactly $75,000.00 of Idaho-adjusted cost. An offer that has to match a $75,000 Idaho standard of living is worth $2,536.23 more than that at national prices.
The subtraction error, priced. Taking 3.5% off the $77,625.00 Idaho figure gives $74,908.13. Run that back through the engine and it returns $77,529.91, $95.09 short of the $77,625.00 you began with. The inverse of a 1.035 multiplication is a division, not a subtraction.
What the 103.5 cannot see. The index is statewide and this page has no metro input, so the Boise and Coeur d'Alene markets that drive the 115.6 housing figure return the same result as rural Idaho. State and local taxes are outside the index entirely: Idaho's income tax, its 6% sales tax and its 0.43% average effective property tax are all separate calculations on this site and none of them feeds the number above.
What This Does Not Account For
- The Boise/Ada County premium versus the rest of Idaho, the largest single distortion in the statewide figure.
- Resort-market pricing in Blaine County (Sun Valley/Ketchum), Valley County (McCall), and Teton County, which sit far above even Boise.
- Idaho income tax and the homeowner's exemption, which are tax effects rather than price-level effects.
- Local option sales taxes levied by designated resort cities on top of the 6% state rate.
Common Pitfalls
- Planning a Boise move off the 103.5 composite. The composite is dragged down by cheap utilities and cheap rural housing; Boise housing is priced closer to the 115.6 figure or above it.
- Assuming cheap power means a cheap state. Idaho's utility advantage is real and structural, but it is a small share of a household budget compared with housing.
- Treating Idaho's housing index as permanent. It is the residue of a specific migration shock; it reflects current price levels, not a fixed regional characteristic.
- Overlooking resort counties. Blaine, Valley, and Teton Counties are not described by any statewide Idaho index.
Frequently Asked Questions
Is Idaho expensive to live in?
Why is Idaho's housing index so much higher than its overall cost of living?
Why are Idaho utilities so cheap?
Is the rest of Idaho as expensive as Boise?
How much salary do I need to maintain my lifestyle in Idaho?
Sources
- U.S. Census Bureau, American Community Survey: Median real estate taxes paid and median home value (Idaho effective rate ≈ 0.43%). census.gov/programs-surveys/acs
- Idaho State Tax Commission, the official state tax authority for Idaho rates, rules and forms. tax.idaho.gov
Also consulted: MERIC: Cost of Living Data Series (2025/2026), composite index 103.5, rank #19; U.S. Energy Information Administration (EIA): State Electricity Profiles. Idaho residential rates and hydro generation share.