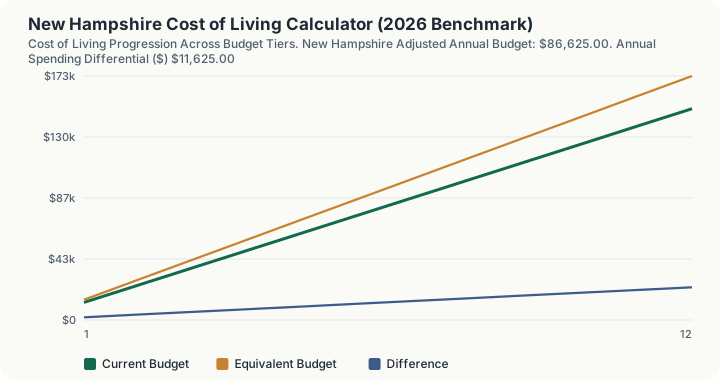
Quick Answer: New Hampshire's cost of living is 15.5% above the U.S. national average (composite index 115.5), so a $75,000.00 national-average household budget costs about $86,625.00 a year in New Hampshire.
A 15.5% Premium With No Income Tax Behind It
Moving a household budget into New Hampshire means scaling it by 115.5/100 (the state's composite cost-of-living index), which runs 15.5% above the U.S. average.
The housing index is the biggest single driver of that gap, at an index of 126.8, followed by utilities (121.2) and groceries (107.4).
New Hampshire is a New England state with no state income or sales tax and roughly mid-pack among Northeastern states; nationally it is among the fifteen most expensive states nationally, which is the figure compensation and relocation planners should anchor to rather than assuming the Northeast moves together as a block. Statewide averages like this one still smooth over real differences between New Hampshire's biggest metro area and its smaller towns.
For a $75,000 reference household, that's a swing of roughly $11,625 a year, and the housing index on its own is 26.8 points above the national 100.0 mark. MERIC compiles the composite quarterly from a wider basket than the three sub-indices listed here, adding transportation, healthcare, and miscellaneous goods and services categories not published separately by state.
Key Index Components for New Hampshire:
- Composite Benchmark Index: 115.5 (Rank #11)
- Housing Cost Index: 126.8
- Utilities Cost Index: 121.2
- Grocery Cost Index: 107.4
How This Is Calculated
New Hampshire is expensive in every category the index tracks. Housing reads 126.8, utilities 121.2 and groceries 107.4, giving a composite of 115.5 and rank 11 of 50. The calculator applies that composite to whatever national-average budget you enter.
- Baseline budget. You enter annual household spending priced at the national benchmark, index 100.0.
- Composite lookup. New Hampshire's composite index of 115.5 is read from the 2026 MERIC state table, along with its rank of #11 among the 50 states.
- Single-factor scaling. The baseline is multiplied by 115.5 and divided by 100. Housing 126.8, groceries 107.4 and utilities 121.2 are shown for context and not separately weighted, since MERIC's composite already handles the weighting. New England energy prices, not just housing, are a structural part of the premium here, and the 121.2 utility reading is what most new arrivals underestimate.
- Differential. The dollar and percentage difference against the baseline is taken from the scaled result, which is what the headline output and the monthly view report.
Worked Example
Using this calculator's baseline scenario: a household needing $75,000.00 a year to sustain a standard basket of goods (housing, groceries, utilities, transportation, and healthcare), priced at the U.S. national average (composite index 100.0).
- National baseline. $75,000.00 is the reference spending level at the national-average price level (index 100.0).
- Apply New Hampshire's composite index. New Hampshire's composite index of 115.5 (rank #11 nationally) means local prices run 15.5% above the national basket. Scaling: $75,000.00 × (115.5 ÷ 100) = $86,625.00.
- Dollar differential. $86,625.00 − $75,000.00 = +$11,625.00, so a household living in New Hampshire needs its budget to grow by that amount to match the same standard of living.
- Percentage and monthly view. That is +15.5% of the baseline, or $7,218.75/mo in New Hampshire versus $6,250.00/mo nationally.
New Hampshire runs meaningfully pricier than the national baseline, with housing costs (index 126.8, 26.8 points above average) the largest single driver of the gap.
What the Schedule Rows Really Contain
The twelve rows under the result apply one index, the composite 115.5, to twelve budget tiers. The column heading says "Equivalent Budget", and every row is one: the tier on that row priced at the rate that produced the headline.
Row 1 applies 115.5 to a $12,500 tier for $14,437.50. Row 2 gives $28,875.00 on $25,000. Row 3 gives $43,312.50 on $37,500. Row 4 gives $57,750.00 on $50,000. New Hampshire sits above parity, so the Difference column is positive on all twelve rows, running from $1,937.50 at the top to $23,250.00 at row 12, where a $150,000 tier prices at $173,250.00.
Row 6 uses your own entry. At $75,000 it prints $86,625.00, which is the headline unchanged, so a reader who scans down to their budget and stops there reads the correct figure.
Right method against wrong method, priced. The correct figure is $75,000 x 115.5 / 100 = $86,625.00, a premium of $11,625.00 over the national baseline. Applying the housing index of 126.8 to everything gives $95,100.00 and a $20,100.00 premium. The error is smaller here in proportional terms than in most states, precisely because New Hampshire's non-housing costs are also high: utilities at 121.2 are not far below housing at 126.8.
Each additional $1,000 of national-baseline budget costs $1,155.00 in New Hampshire. Raising the entry from $75,000 to $76,000 moves the adjusted figure from $86,625.00 to $87,780.00, and the differential stays at 15.5% at every level.
The reverse question: what national-average budget corresponds to $100,000 of New Hampshire spending? An $86,580 baseline adjusts to $99,999.90 and $86,581 adjusts to $100,001.06. A household spending $100,000 in New Hampshire is living at roughly an $86,581 national standard, and the $13,420 difference is what the index is measuring.
One thing this figure does not include, and it matters here more than elsewhere. New Hampshire levies no broad personal income tax and no sales tax, and the composite index of 115.5 measures prices, not tax burden. The calculator makes no adjustment for either, so a take-home-pay comparison against an income-tax state will not be captured by the $86,625.00 shown.
What This Does Not Account For
- No category weighting is performed. The engine multiplies your budget by the composite figure of 115.5 alone. Housing at 126.8, groceries at 107.4 and utilities at 121.2 are shown for context and never enter the calculation.
- The schedule has no resolution below the state line. Every row uses the same statewide 115.5, so a Portsmouth household and a Berlin household are priced identically at each of the twelve budget levels.
- No tax adjustment of any kind is made, which understates New Hampshire's relative position for a household comparing after-tax purchasing power against an income-tax state.
- Intra-state variance between major metropolitan urban centers and rural counties within New Hampshire. One statewide 115.5 applies everywhere, so Manchester and a North Country town both return $86,625.00 on a $75,000 budget.
- Discretionary lifestyle choices, private schooling, and luxury expenditures.
- State income and property tax impacts on disposable take-home salary.
- Dynamic seasonal utility price surges during peak winter heating or summer cooling months.
Common Pitfalls
- Comparing State Averages Instead of Metro Areas: Living in a major metro area is often 20%-40% more expensive than the statewide average.
- Focusing Solely on Housing: Overlooking higher utility, transportation, or food costs in colder or remote regions.
- Ignoring Net Take-Home Pay: Comparing gross salary without factoring in state income and sales tax differentials.
- Failing to Adjust for Family Size: Larger households experience disproportionately higher grocery and healthcare expenditures.
Frequently Asked Questions
Is New Hampshire expensive to live in?
What is the biggest cost factor in New Hampshire?
How much salary do I need to maintain my lifestyle in New Hampshire?
How often are cost of living indices updated?
Sources
- U.S. Bureau of Economic Analysis (BEA): Regional Price Parities. bea.gov/data/prices-inflation/regional-price-parities-state-and-metro-area
- U.S. Bureau of Labor Statistics (BLS): Consumer Expenditure Survey. bls.gov/cex
Also consulted: MERIC: Cost of Living Data Series (2025/2026).