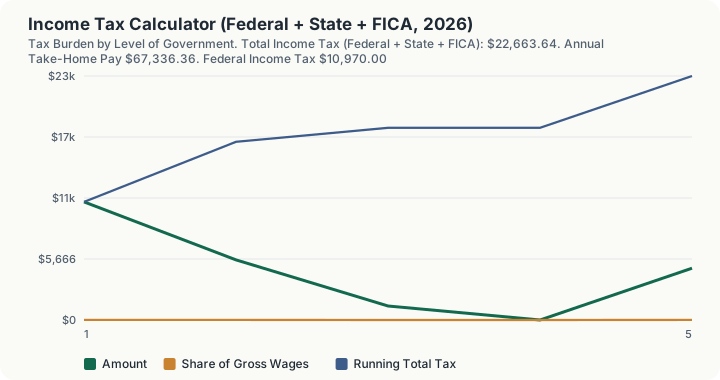
Quick Answer: On $90,000 of wages, filing single in California for 2026, total income tax is $22,663.64: $10,970.00 federal, $6,885.00 in FICA payroll tax, and $4,808.64 to California. That is a 25.18% total effective rate, leaving $67,336.36 of take-home pay.
What does this calculator do?
Ask most people what tax rate they pay and they will name a federal bracket. That answer is wrong twice over. It ignores the two other layers that come out of the same paycheck, and it confuses a marginal rate with an effective one.
This calculator gives the all-in figure. It runs your wages through three independent tax systems, each with its own base, its own schedule, and its own quirks, and then reports both what each layer takes and what they take together. The federal income tax has a standard deduction and seven graduated brackets. FICA has no deduction at all, a hard cap on one component and none on the other. Your state may have graduated brackets, a flat rate, or nothing at all. These three systems do not share a tax base and they do not stack neatly, which is exactly why a single bracket number tells you so little.
It sits between two narrower tools. The federal income tax calculator models one layer in depth. The state paycheck calculators translate a salary into a per-pay-period net figure. This page answers the annual question instead: of everything you earned this year, how much went to tax, and to whom.
How is this calculated?
- Subtract pre-tax deductions from wages. Traditional 401(k) deferrals, HSA contributions, and pre-tax health premiums come out of the wage base used for income tax. In the default case there are none, so the income tax base stays at $90,000.
- Apply the federal standard deduction. The 2026 standard deduction for your filing status is subtracted to give federal taxable income. For a single filer that is $16,100, leaving $73,900.
- Walk the federal brackets. Each 2026 bracket taxes only the income falling inside its own floor and ceiling. The shared bracket primitive does this against the verified table, and the sum is the federal income tax.
- Subtract any federal credits. Non-refundable credits you enter reduce the federal income tax, floored at zero. They do not touch the other two layers.
- Levy Social Security tax on gross wages. 6.2% applies to wages up to the 2026 wage base of $184,500. Note the base: it is gross wages, not the post-deferral figure from step 1.
- Levy Medicare tax on gross wages. 1.45%, with no ceiling of any kind.
- Levy Additional Medicare tax where it applies. 0.9% on wages above your filing status threshold, which is $200,000 for a single filer.
- Walk the state brackets. Your state's 2026 rate schedule is applied to the post-deduction wage base from step 1.
- Add the three layers. Federal income tax plus total FICA plus state income tax is the total tax.
- Divide to get the effective rate. Total tax divided by gross wages, expressed as a percentage.
The combined marginal rate reported alongside the total is:
r_marginal = r_federal + r_state + r_SS + r_Medicare
where the Social Security term drops to zero once wages exceed the wage base, which is why high earners face a lower combined marginal rate than the raw federal bracket suggests.
Worked Example
Take $90,000 in wages, filing single, resident in California, with no pre-tax deductions and no credits.
Step 1. Income tax base: $90,000 minus $0 of pre-tax deductions equals $90,000.
Step 2. Federal taxable income: $90,000 minus the $16,100 standard deduction equals $73,900.
Step 3. First federal bracket: 10% of $12,400 equals $1,240.00.
Step 4. Second bracket: 12% of ($50,400 minus $12,400), which is 12% of $38,000, equals $4,560.00.
Step 5. Third bracket: 22% of ($73,900 minus $50,400), which is 22% of $23,500, equals $5,170.00.
Step 6. Federal income tax: $1,240.00 plus $4,560.00 plus $5,170.00 equals $10,970.00.
Step 7. Social Security: $90,000 times 6.2% equals $5,580.00.
Step 8. Medicare: $90,000 times 1.45% equals $1,305.00.
Step 9. Additional Medicare: wages are below the $200,000 single threshold, so this is $0.00.
Step 10. Total FICA: $5,580.00 plus $1,305.00 equals $6,885.00.
Step 11. California brackets on $90,000, summed tier by tier on the FTB 2025 Schedule X: $110.79 plus $303.70 plus $607.52 plus $965.40 plus $1,214.56 plus $1,606.67 equals $4,808.64.
Step 12. Total tax: $10,970.00 plus $6,885.00 plus $4,808.64 equals $22,663.64.
Step 13. Take-home: $90,000 minus $22,663.64 equals $67,336.36.
Step 14. Effective rate: $22,663.64 divided by $90,000 equals 25.18%.
Note the gap between that 25.18% and the 22% federal bracket this filer sits in. The bracket is neither an upper nor a lower bound on the real burden.
Now deferring $24,500 into a traditional 401(k) changes only two of the three layers. Federal income tax falls to $5,680.00 and California tax falls to $2,781.40, but FICA stays at exactly $6,885.00, because payroll tax is levied on gross wages regardless of the deferral.
What does this calculator not account for?
- State deductions, exemptions and credits. The state layer applies your state's bracket schedule directly to the wage base. It does not apply state standard deductions, personal exemptions, or state-level credits, all of which vary widely and would lower the figure shown. The state result is therefore an upper bound on state liability in most states.
- State head-of-household and married-separately schedules. Married Filing Jointly uses a state's verified joint schedule where the state tax table holds one; Head of Household and Married Filing Separately use the state's single schedule, which overstates state tax for a head of household in states that widen their brackets for that status.
- Local and city income taxes. New York City, Philadelphia, and hundreds of Ohio and Pennsylvania municipalities levy their own income tax. None is included.
- Itemized deductions. The federal layer always uses the standard deduction. A filer with large mortgage interest, state and local taxes, or charitable giving may itemize to a lower federal figure.
- Non-wage income. Only W-2 wages are modeled. Capital gains, qualified dividends, self-employment income, and rental income all have their own treatment and their own calculators.
- Refundable credits. The credit field reduces federal tax to zero but no further. The Earned Income Tax Credit and the refundable portion of the Child Tax Credit can produce a negative federal liability, which this page does not model.
- The employer half of FICA. The employer pays a matching 6.2% and 1.45%. Economists generally treat that as borne by the worker in the form of lower wages, but it is not withheld from your pay and is not counted here.
What mistakes do people make with this?
- Assuming your bracket is your rate. The default filer sits in the 22% federal bracket and pays 12.19% of gross wages in federal income tax. Progressive brackets guarantee that the effective rate is always below the top marginal rate.
- Expecting a 401(k) deferral to cut payroll tax. It does not. Elective deferrals are excluded from income tax but remain fully subject to Social Security and Medicare. This surprises people every year.
- Forgetting that Social Security tax stops. Above the $184,500 wage base, the next dollar of wages carries no Social Security tax at all. That is why the $250,000 filer in the built-in vector faces a 33.45% combined marginal rate while sitting in a 32% federal bracket.
- Comparing states on the top rate alone. California's headline rate is far above most states, but the graduated schedule means a $90,000 filer pays an effective 5.34%, not 9.3%.
- Treating the no-income-tax states as tax-free. Nine states levy no wage income tax, and several of them recover the revenue through notably higher property or sales taxes that this calculator does not see.
Frequently Asked Questions
What is my actual tax rate?
Why is FICA calculated on a different number than income tax?
How does this differ from the federal income tax calculator?
Does moving to a state with no income tax save the amount shown?
Why does the calculator show both an effective rate and a marginal rate?
Sources
- Internal Revenue Service, Revenue Procedure 2025-32 (Internal Revenue Bulletin 2025-45), for 2026 federal brackets and standard deduction amounts: irs.gov/pub/irs-drop/rp-25-32.pdf
- Social Security Administration, "2026 Social Security Changes" fact sheet, for the 2026 Social Security wage base and payroll tax rates: ssa.gov/news/press/factsheets/colafacts2026.pdf