Quick Answer: $10,500 all in, returning $18,000 at exit plus $1,200 of cash income along the way, is a return on investment of 82.857% and a net profit of $8,700.00. Held for five years, that is an annualised return of 12.829% a year. Those two numbers describe the same investment and only one of them can be compared against anything else.
What does this calculator do?
Return on investment is the most quoted and most abused figure in finance, for one reason: it has no time in it. An 82.857% return is excellent over five years and mediocre over twenty, and the ROI number itself cannot tell you which you are looking at. This calculator therefore always reports both the total return and its annualised equivalent, because the annualised figure is the one that permits comparison.
It is deliberately the general tool. It takes any capital outlay, any costs, any exit value, any income received along the way, and any holding period. That makes it right for a stock position, a private investment, a piece of equipment, a marketing spend, a collectible, or a business project. If you are analysing a specific property strategy, the short-term rental ROI and fix-and-flip ROI calculators encode the cost structures those deals actually have, which a general tool cannot.
Two design choices matter here. Costs are a separate field, because the single most common way ROI gets overstated is by comparing the sale price to the purchase price and quietly forgetting the fees. In the default case, dropping $500 of costs moves the reported return from 82.857% to 92.000%, which is a nine point lie for the sake of a rounding-sized number. And income is a separate field, because a return that comes mostly from cash distributions has a completely different risk profile from one that depends entirely on the exit price.
How is this calculated?
ROI = (Proceeds − Cost)/Cost; CAGR = (Proceeds/Cost)^(1/n) − 1
Step 1: Add every cost to get the true basis. $10,000 + 500 = \$10,500.00$
Step 2: Add income to the exit value to get total proceeds. $18,000 + 1,200 = \$19,200.00$
Step 3: Subtract to get net profit. $19,200 - 10,500 = \$8,700.00$
Step 4: Divide the profit by the basis for ROI. $8,700 \div 10,500 = 0.82857143 = 82.857\%$
Step 5: Divide the proceeds by the basis for the multiple. $19,200 \div 10,500 = 1.8286x$
Step 6: Take the nth root of that multiple, where n is the holding period. $1.8285714286^{1/5} = 1.12829428$
Step 7: Subtract one to express it as an annual rate. $1.12829428 - 1 = 12.829\%$ per year
Step 8: Split the profit into its two sources. Capital gain is $18,000 - 10,500 = \$7,500.00, and income is \1,200.00, which is $1,200 \div 8,700 = 13.8\%$ of the profit.
The multiple in step 5 is always exactly one greater than the ROI expressed as a fraction. That is not a coincidence, it is the same division written two ways, and it is asserted as a test vector in the engine.
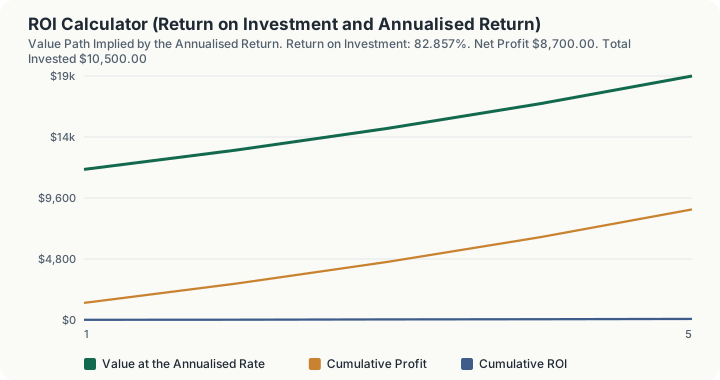
The table applies the annualised rate from step 7 to the starting basis year by year. That smooth curve is not what happened; it is the constant-growth path equivalent to what happened, which is the only thing an annualised figure ever claims to be.
Worked Example
The default position. You put in $10,000, spend $500 on commissions, collect $1,200 in dividends over five years, and sell for $18,000.
- Basis: $10,500.00
- Proceeds: $19,200.00
- Profit: $8,700.00
- ROI: 82.857%
- Multiple: 1.8286x
- Annualised: 12.829%
Forget the $500 of costs. ROI reads 92.000% and the annualised figure 13.936%. Nothing about the investment changed. The reported performance improved by more than a full percentage point a year purely through omission.
Earn the same profit in one year instead of five. ROI is unchanged at 82.857%, because ROI cannot see time. The annualised return is now 82.857% as well, and it is a completely different investment. This is the entire argument for never quoting ROI without the holding period beside it.
Take a loss. Sell for $7,500 with no income. ROI is -28.571% and the annualised figure is -6.508%. Note how much gentler the annual number looks: spreading a loss across five years is arithmetically correct and psychologically misleading, which cuts in the opposite direction from the usual complaint about ROI.
Carrying the Annualised Rate Forward
The annualised figure describes a smooth 12.829% curve. Laying that curve out year by year on the $10,500 basis:
- End of year one: value $11,847.09, cumulative profit $1,347.09, cumulative ROI 12.83%
- End of year two: value $13,367.00, cumulative profit $2,867.00, cumulative ROI 27.30%
- End of year three: value $15,081.91, cumulative profit $4,581.91, cumulative ROI 43.64%
- End of year five: value $19,200.00, cumulative profit $8,700.00, cumulative ROI 82.86%
Two years at 12.829% produce 27.30% of cumulative ROI, not 25.66%. The extra 1.64 points is the compounding that simple ROI arithmetic silently discards, and by year five the divergence is 18.71 points: 82.86% actual against the 64.15% that five times the annual rate would suggest. This is the same error in the opposite direction from the one in the section above, and it is why the two figures should never be converted into each other by multiplication.
What does this calculator not account for?
- Taxes. Every figure here is pre-tax. Capital gains and income are usually taxed at different rates, so the after-tax split between the two sources is not the pre-tax split.
- The timing of cash flows within the period. Income received in year one is worth more than the same income in year five. This treats all income as a single sum, which is why an IRR or money-weighted return on dated cash flows is the more precise tool when the flows are lumpy.
- Additional contributions after the start. The model has one entry point. Money added partway through is not handled correctly by any ROI figure and needs an IRR.
- Inflation. All returns are nominal. Use the inflation calculator to convert an annualised return into a real one.
- Risk. Two investments with the same annualised return are not equivalent if one of them could have gone to zero.
- Leverage. If part of the position was borrowed, the ROI on your own cash and the ROI on the asset are different numbers, and interest paid belongs in costs.
- Unrealised versus realised. Entering a current market value rather than a sale price gives a paper return, before the transaction costs of actually exiting.
What mistakes do people make with this?
- Quoting ROI without the holding period. It is the defining flaw of the measure. Always pair it with the annualised figure.
- Leaving costs out of the basis. Commissions, fees, improvements and carrying costs all belong in the denominator.
- Confusing the multiple with the return. A 1.83x multiple is an 83% return, not a 183% one.
- Averaging annual returns arithmetically. A 50% gain followed by a 50% loss averages to zero and leaves you down 25%. Only the compounded root gets this right.
- Comparing a leveraged ROI to an unleveraged one. Borrowed money inflates the percentage without improving the investment.
- Reading a small negative annualised number as a small loss. -6.508% a year is a 28.571% hole.
Frequently Asked Questions
How do you calculate ROI?
What is a good ROI?
What is the difference between ROI and annualised return?
Should I include fees in the calculation?
How do I handle dividends or rent?
Why does my losing investment show a smaller annual loss than I expected?
Can I use this if I added money partway through?
Sources
- U.S. Securities and Exchange Commission, Investor.gov, the official authority for the investing this calculator relates to. investor.gov
There is no statutory or regulatory source for these formulas, and none is invented here. Return on investment as (proceeds minus cost) divided by cost, and the compound annual growth rate as the nth root of the terminal-to-initial ratio, are standard definitions in financial analysis rather than legal constructs.
Where a rule does exist it governs presentation, not arithmetic: investment managers reporting performance to clients in the United States and elsewhere commonly follow the CFA Institute's Global Investment Performance Standards, which require time-weighted returns for composite reporting precisely because a simple ROI can be manipulated by the timing of cash flows. That standard does not apply to an individual computing a return on their own position, and this calculator does not claim to implement it.
The implementations are simpleROI, investmentMultiple and calculateCAGR in engine/primitives/returns.ts, proven against hand-derived vectors in engine/vectors/returns.test.ts. The value path in the table is generated by solveFV in engine/primitives/tvm.ts at the annualised rate.