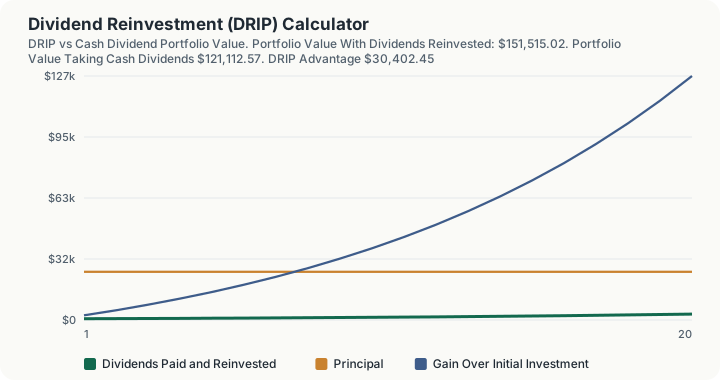
Quick Answer: Reinvesting dividends instead of taking them as cash lets you buy more shares with every payout, so future dividends land on a bigger share count, which is why DRIP portfolios compound faster than identical holdings that just collect cash.
Overview
A Dividend Reinvestment Plan, usually shortened to DRIP, takes the cash dividend a stock pays you and uses it to buy additional shares automatically, often with no commission and sometimes at a small discount to the market price. Most brokerages offer this as a free account setting today, so the real question isn't whether you can do it, it's how much difference it actually makes over a long holding period.
This calculator projects a stock position forward year by year under two paths that start identical: one where every dividend buys more shares, and one where the same dividends are paid out in cash and left sitting on the side, unreinvested. Both paths experience the same share price appreciation and the same dividend growth. The only variable that changes is what happens to the dividend cash. That isolation is the point. It lets you see the pure effect of compounding rather than mixing it up with "dividend stocks are good investments," which is a separate question this tool doesn't try to answer.
The mechanics matter here. Each year, your existing share count is paid a dividend per share. Under DRIP, that dollar amount is divided by the current share price to determine how many new shares you just bought, and those new shares get added to your count before next year's dividend is calculated. That's the compounding loop: more shares this year means more dividend income next year, which buys even more shares the year after. Under the cash path, your share count never changes; the dividend just gets added to a growing cash pile that earns nothing.
How This Is Calculated
The engine walks the position forward one year at a time. For each year:
- The share price grows by your assumed annual price appreciation rate.
- The dividend per share grows by your assumed annual dividend growth rate.
- The dividend owed to your current share count is calculated (shares held times dividend per share).
- Under DRIP, that dividend amount is divided by the new share price to determine new shares purchased, which are added to your running share count.
- Under the no-DRIP comparison, the identical dividend dollar amount is added to a cash pile that does not grow or get reinvested.
- Both portfolio values are recorded: DRIP value is share count times price; no-DRIP value is the original share count times price, plus the accumulated cash pile.
This all runs on Decimal.js arbitrary-precision arithmetic rather than native floating point, so there's no creeping rounding error across a 20 or 30-year projection. A secondary metric, the compound annual growth rate (CAGR) of each path, is calculated using the platform's shared returns.ts primitive rather than a bespoke formula, comparing the ending value to the initial investment over the number of years modeled.
Two things worth flagging about the model. First, "years" here means full years of compounding starting immediately. Growth and dividend increases apply every single year, including year one, which mirrors how the platform's other multi-year projections (like the 401(k) calculator) treat their first year. Second, share price growth and dividend growth are independent inputs. In the real world they're loosely correlated (a company that grows earnings tends to grow both), but treating them separately lets you stress-test scenarios where a stock's price stalls while its dividend keeps climbing, or vice versa.
Worked Example
An investor holds 500 shares at $50, a $25,000 position yielding 2.5%. The dividend has been growing 6% a year and the share price 7%. The question is whether ticking the reinvest box actually matters.
Step 1 -- The starting position. 500 shares x $50 = $25,000
Step 2 -- The starting dividend per share. $50 x 2.5% = $1.25
Year One
Step 3 -- Share price after a year of 7% growth. $50 x 1.07 = $53.50
Step 4 -- Dividend per share after 6% growth. $1.25 x 1.06 = $1.325
Step 5 -- Dividend cash on 500 shares. 500 x $1.325 = $662.50
Step 6 -- Shares bought with that dividend. $662.50 / $53.50 = 12.3832 shares
Step 7 -- Share count after reinvesting. 500 + 12.3832 = 512.3832
Step 8 -- Both paths after year one. DRIP and cash are both worth $27,412.50 -- reinvesting has bought shares, not value
Year Two, and Where the Paths Separate
Step 9 -- Share price. $53.50 x 1.07 = $57.245
Step 10 -- Dividend per share. $1.325 x 1.06 = $1.4045
Step 11 -- Dividend cash on the DRIP path, now on 512.3832 shares. 512.3832 x $1.4045 = $719.64
Step 12 -- Dividend cash on the no-DRIP path, still on 500 shares. 500 x $1.4045 = $702.25
Step 13 -- DRIP portfolio value. = $30,051.02
Step 14 -- No-DRIP portfolio value. 500 shares at $57.245 plus $1,364.75 of accumulated cash = $29,987.25
Step 15 -- The DRIP advantage after two years. $30,051.02 - $29,987.25 = $63.77
Sixty-three dollars, on a $25,000 position, after two years. Step 15 is deliberately unimpressive, because it shows where the effect comes from: the entire gap is step 11 minus step 12, the $17.39 of extra dividend earned by the 12.38 shares bought in year one. Reinvestment does not improve the stock, it only enlarges the base the next dividend is paid on.
Twenty Years of the Same Thing
Step 16 -- Final share count. = 783.09 shares
Step 17 -- Total dividends reinvested. = $31,929.92
Step 18 -- DRIP portfolio value. = $151,515.02
Step 19 -- No-DRIP portfolio value. = $121,112.57
Step 20 -- The advantage. $151,515.02 - $121,112.57 = $30,402.45
Step 21 -- The two annualised returns. 9.43% with reinvestment against 8.21% without
A $63.77 edge at two years becomes $30,402.45 at twenty, which is more than the original investment. The underlying stock performed identically in both columns. The entire difference is 283 extra shares, bought a few at a time, each one earning dividends of its own from the moment it was purchased.
What This Does Not Account For
- Taxes. Dividends are typically taxable in the year they're paid, whether you reinvest them or not, unless the position is held in a tax-advantaged account like an IRA or 401(k). This tool does not model dividend tax withholding or its drag on the cash path's growth.
- Dividend cuts or suspensions. The model assumes the dividend grows steadily every year. Real companies cut dividends during downturns, and a growth rate that looks reasonable in a spreadsheet can be wildly wrong in a recession.
- Fractional share mechanics and brokerage-specific rules. Some brokers round DRIP purchases to whole shares, some allow true fractional shares, and some apply a small purchase discount. This model assumes clean fractional-share reinvestment with no discount.
- Transaction costs on the cash path. In practice, someone taking cash dividends might reinvest them manually in a different asset, or spend them. The comparison here assumes the cash is simply held, not invested elsewhere or spent.
- Sequence-of-returns risk. A single constant growth rate for share price smooths over the actual up-and-down path markets take, which affects how much benefit reinvestment provides in any specific historical period.
Common Pitfalls
- Assuming yield alone tells the story. A high current yield with no dividend growth compounds far more slowly than a modest yield paired with strong dividend growth, because the second scenario keeps buying more shares at an accelerating dividend rate.
- Forgetting DRIP still generates a tax bill. Just because the cash never touches your bank account doesn't mean the IRS agrees it wasn't income, outside of tax-sheltered accounts.
- Comparing DRIP against "doing nothing" instead of against reinvesting elsewhere. The real-world alternative to DRIP usually isn't holding cash, it's investing the dividend cash into something else. If you'd reinvest the cash into the same or a similar asset manually, the gap between the two paths shrinks toward the cost of manual reinvestment (mainly time and any transaction fees).
- Using a share price growth rate detached from the dividend growth rate. For a mature, stable dividend payer, price appreciation and dividend growth tend to move together over long periods, since both usually track earnings growth. Wildly different assumptions for the two can produce projections that don't reflect how the underlying business could plausibly perform.
Frequently Asked Questions
Does DRIP cost anything?
Is DRIP better than taking dividends as cash?
Do I owe taxes on reinvested dividends?
What's a realistic dividend growth rate to assume?
Why does the DRIP advantage look small in the first year or two but grow so much later?
Sources
- Internal Revenue Service, Publication 550, "Investment Income and Expenses," for the general tax treatment of dividends, including reinvested dividends, in taxable accounts. irs.gov/publications/p550
Also consulted: S&P Dow Jones Indices, S&P 500 dividend yield and per-share dividend growth historical data, used as the basis for this calculator's illustrative default assumptions (not a statutory or regulated figure).