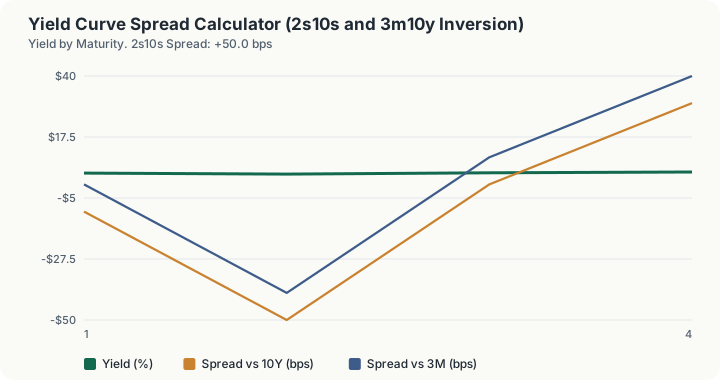
Quick Answer: With a 3-month bill at 4.20%, a 2-year at 3.80%, a 10-year at 4.30% and a 30-year at 4.60%, the 2s10s spread is +50.0 basis points. The 3m10y is +10.0 bps, the 10s30s +30.0 bps and the 2s30s +80.0 bps. Neither headline spread is inverted, so the curve is normal and upward sloping, in the moderately steep band.
What does this calculator do?
The yield curve is the set of Treasury yields plotted against maturity, and a curve spread is just the difference between two points on it, quoted in basis points. Ordinarily longer money costs more, because lenders want compensating for locking capital up and for the uncertainty that comes with time. When that ordering reverses, when the 2-year yields more than the 10-year, something unusual is being priced.
Two spreads dominate the commentary. The 2s10s is the 10-year less the 2-year, the most widely quoted. The 3m10y is the 10-year less the 3-month bill, which several Federal Reserve research papers have preferred on the grounds that the very short end tracks current policy more directly.
Everything on this page is arithmetic on par yields you supply. Nothing here is a stored rate table, nothing forecasts anything, and no probability of anything is estimated. The labels attached to the spreads describe their sign and size, and that is all they do.
How is this calculated?
A spread in basis points is the difference between two yields, times one hundred.
spread_bps = (y_long − y_short) × 100
Step 1: Compute the 2s10s spread. 4.30% - 3.80% = 0.50 percentage points 0.50 x 100 = +50.0 basis points
Step 2: Compute the 3m10y spread. 4.30% - 4.20% = 0.10 percentage points 0.10 x 100 = +10.0 basis points
Step 3: Compute the 10s30s spread, which shows whether the long end is steepening on its own. 4.60% - 4.30% = +30.0 basis points
Step 4: Compute the 2s30s spread, the widest span on the page. 4.60% - 3.80% = +80.0 basis points
Step 5: Test for inversion. A spread is inverted when it is negative. Both headline spreads are positive here, so the status is not inverted.
Step 6: Classify the shape. Neither headline spread is negative, and the 2s10s is at or above 25 bps, so the shape is Normal, upward sloping. Below 25 bps and still positive it would be labelled flat but positively sloped.
Step 7: Band the steepness by size rather than sign. At +50.0 bps the curve falls in the 25 to 100 bps band: Moderately steep. The bands run from deeply inverted below -100 bps, through clearly inverted, marginally inverted, flat, moderately steep, and steep above 100 bps.
Step 8: Compute the implied forward rate. Treating the par yields as annually compounded zero rates, the 8-year rate implied two years forward is
f_(2, 8) = (((1 + y₁₀)¹⁰)/((1 + y₂)²))^(1/8) − 1
Grow out ten years at the 10-year yield: 1.043¹⁰ = 1.523535 Grow out two years at the 2-year yield: 1.038² = 1.077444 Divide: 1.523535 / 1.077444 = 1.414025 Take the eighth root: 1.414025^(1/8) = 1.044242 Subtract one: 4.425%
Step 9: Compare that forward against the spot 10-year. 4.425% - 4.300% = 0.125 percentage points = +12.5 basis points
The forward sits above the spot 10-year, which is the ordinary result when the curve slopes upward. On an inverted curve it falls below, which is the arithmetic behind the observation that an inverted curve embeds an expectation of lower rates ahead.
This forward calculation is an approximation and the engine says so in its own source. Par yields are not zero rates, and using them as if they were introduces an error that grows with the coupon and with the steepness of the curve. For a rough read on what the curve implies about future rates it is adequate; for anything requiring precision, a bootstrapped zero curve is required and this page does not build one.
Worked Example
You want to know what the curve is saying on a day when the bill yields 4.20%, the 2-year 3.80%, the 10-year 4.30% and the 30-year 4.60%.
Step 1: The headline. 4.30% - 3.80% = +50.0 bps. Positive, so the 2s10s is not inverted.
Step 2: The second opinion. 4.30% - 4.20% = +10.0 bps. Also positive, but only barely. The very front end is nearly as high as the 10-year.
Step 3: Notice the shape between the two. The 2-year at 3.80% sits below both the 3-month at 4.20% and the 10-year at 4.30%. The curve dips in the middle and rises again. That is a humped or partially inverted front end, and it is visible in the 3m to 2y leg even though both headline spreads read positive.
Step 4: Look at the long end separately. 10s30s is +30.0 bps. The long end is still positively sloped, so nothing unusual is happening past ten years.
Step 5: Read the forward. 4.425%, which is 12.5 bps above the spot 10-year. Taking the yields at face value, the market is pricing 8-year money starting two years from now slightly above where 10-year money prices today.
Step 6: Try the inverted case. Set the 3-month to 5.35%, the 2-year to 4.60%, the 10-year to 4.20% and the 30-year to 4.45%. The 2s10s becomes -40.0 bps and the 3m10y -115.0 bps: both inverted, the shape label changes, and the implied forward drops below the spot 10-year. The historical framing note on the page changes accordingly, and it is worth reading exactly what it does and does not say.
What does this calculator not account for?
- Any forecast, probability or model. This page performs subtraction and one root extraction. It does not estimate a recession probability, does not fit a term structure model, and does not produce a signal. The historical framing line attached to the inversion status is a statement about past cycles, not an output of the arithmetic and not a prediction.
- Live market data. Every yield is one you type. The defaults are illustrative round numbers. A spread computed from stale yields is a stale spread, and nothing here fetches or validates a quote.
- The par-versus-zero distinction. The implied forward treats quoted par yields as annually compounded zero rates. They are not. The error grows with coupon size and curve steepness, and a proper calculation requires bootstrapping a zero curve from the coupon strip.
- Compounding and quotation conventions. Treasury bills are quoted on a discount basis and converted to bond-equivalent yield; notes and bonds are quoted semiannually. Mixing conventions between the inputs will shift the spreads by a few basis points, and the calculator cannot detect that you have done so.
- The term premium. A curve slope reflects both expected future short rates and the premium investors demand for duration. This page cannot separate them, and the implied forward conflates the two.
- Real versus nominal. All yields are nominal. Nothing here decomposes them into real yields and inflation compensation.
- Credit, swaps and other curves. Treasury only. Corporate spreads, swap spreads and the overnight index swap curve are all outside this page.
- Intermediate maturities. Four points define the curve here: 3-month, 2-year, 10-year and 30-year. The 5-year and 7-year, where humps and kinks often appear first, are not inputs.
What mistakes do people make with this?
- Treating an inversion as a timer. The historical record is that US recessions since the mid 1950s have been preceded by a 2s10s inversion, but the lead time has ranged from roughly six months to two years, and there has been at least one inversion no recession followed. A spread is not a date.
- Watching only the 2s10s. The 3m10y frequently inverts at a different point in the cycle, sometimes earlier and sometimes later. Several Federal Reserve research papers prefer it. At the defaults here, one reads +50.0 bps and the other +10.0 bps: same curve, very different impressions of how close to flat it is.
- Ignoring the re-steepening. Curves have historically re-steepened, often sharply, before the recession arrives, as the front end falls faster than the long end. An investor watching only for inversion will see the signal disappear at the point it mattered most.
- Mixing quotation conventions. Bill yields on a discount basis and note yields on a bond-equivalent basis are not directly subtractable. Use constant-maturity series on a consistent basis if you are trying to match published spreads.
- Reading a positive curve as an all clear. A positively sloped curve is the ordinary state of the world. It carries no information by itself, and the page says so in exactly those terms.
- Confusing the implied forward with a prediction. It is what the two spot yields arithmetically require if no arbitrage exists between them. It is not what anyone expects rates to be, and the gap between the two is the term premium.
- Missing an inversion between the quoted points. At the defaults the 2-year sits below the 3-month, a genuine front-end inversion, while both headline spreads read positive. Look at the yields themselves, not only at the two headline differences.
Frequently Asked Questions
What does an inverted yield curve actually mean?
Which spread should I watch, the 2s10s or the 3m10y?
Why is the spread quoted in basis points?
What is the implied forward rate telling me?
Can the curve be inverted in one place and normal in another?
Does this calculator predict a recession?
Where do I get the yields to enter?
Sources
- US Department of the Treasury, Daily Treasury Par Yield Curve Rates. The standard published source for the constant-maturity yields these spreads are computed from. home.treasury.gov/resource-center/data-chart-center/interest-rates/TextView
- U.S. Securities and Exchange Commission, Investor.gov, the official authority for the investing this calculator relates to. investor.gov
Also consulted: Estrella, A., and Mishkin, F.S., "Predicting U.S. Recessions: Financial Variables as Leading Indicators," Review of Economics and Statistics, 1998. The research line behind the preference for the 3-month to 10-year spread; Estrella, A., and Hardouvelis, G.A., "The Term Structure as a Predictor of Real Economic Activity," Journal of Finance, 1991; The implied forward uses the standard no-arbitrage relation between two spot rates, applied to par yields treated as annually compounded zero rates. The engine documents this as an approximation, because par yields are not zero rates.