Quick Answer: Enter your starting value, ending value, and the number of years between them to find the single smoothed annual growth rate that would have produced that same result if it compounded steadily every year.
Overview
Compound Annual Growth Rate answers a question that a simple total-return percentage cannot: if an investment grew unevenly, up 40% one year, down 10% the next, what constant annual rate would have produced the same overall result? CAGR smooths a bumpy, real-world return path into one clean number, which is exactly why it is the standard way analysts, fund reports, and business plans communicate growth over multi-year periods.
This calculator is built for comparing investments, business revenue, or any other value that grows over more than one year, on an apples-to-apples annualized basis. It takes a beginning value, an ending value, and a holding period in years, and returns the nominal CAGR, the total absolute return over the full period, the inflation-adjusted real CAGR, the investment multiplier (how many times the money grew), and the approximate number of years it would take to double at that growth rate.
CAGR is a geometric average, not an arithmetic one, which is the detail most people get wrong when they try to estimate it by hand. Averaging three yearly percentage returns arithmetically overstates true compounded growth whenever returns are volatile; CAGR corrects for that by construction, which is why it is the number that appears in fund fact sheets and business growth reporting instead of a simple year-over-year average.
How This Is Calculated
CAGR is derived from the ratio of ending value to beginning value, raised to the power of one divided by the number of years, then converted to a percentage:
CAGR = [(Ending Value ÷ Beginning Value)^(1 ÷ Years) − 1] × 100
This is the geometric mean growth rate: the constant annual rate that, compounded once per year for the full holding period, turns the beginning value into the ending value exactly.
Total absolute return is the simpler, non-annualized comparison, the full percentage gain or loss over the entire period regardless of how many years it took:
Total Return = [(Ending Value − Beginning Value) ÷ Beginning Value] × 100
Real CAGR adjusts the nominal growth rate for inflation using the exact (not approximated) Fisher relationship, so that a high nominal CAGR during a high-inflation period is correctly shown as a smaller gain in purchasing power terms:
Real CAGR = [(1 + Nominal CAGR) ÷ (1 + Inflation Rate) − 1] × 100
The investment multiplier is simply Ending Value ÷ Beginning Value expressed as an "x" figure, and doubling time is estimated with the Rule of 72 (72 ÷ CAGR), a widely used approximation for how long compounding at a given rate takes to double an amount. All exponentiation and division runs through Decimal.js to avoid the rounding drift that plagues CAGR calculations done in standard floating-point spreadsheet formulas, particularly with fractional year inputs.
Worked Example
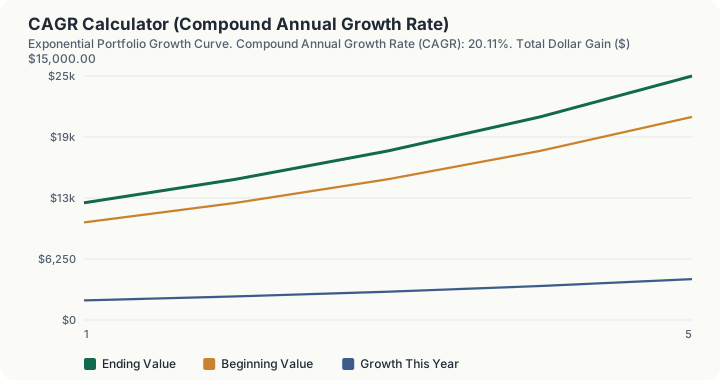
An investor sold a holding that went from $10,000 to $25,000 over five years and wants to state that as an annual rate, not a headline percentage, so it can be compared against an index.
Step 1 -- The growth ratio. $25,000 / $10,000 = 2.5
Step 2 -- The exponent. 1 / 5 years = 0.2
Step 3 -- The compound annual growth rate. 2.5^0.2 - 1 = 1.2011 - 1 = 20.11%
Step 4 -- Total absolute return, not annualised. ($25,000 - $10,000) / $10,000 = 150.00%
Step 5 -- Total dollar gain. $25,000 - $10,000 = $15,000
Checking the Rate Against the First Two Years
CAGR is a claim: that this smooth rate reproduces the actual endpoint. It is worth watching it do so.
Step 6 -- Balance after year one at 20.11%. $10,000 x 1.2011 = $12,011.24
Step 7 -- Gain in year one. $12,011.24 - $10,000 = $2,011.24
Step 8 -- Balance after year two. $12,011.24 x 1.2011 = $14,427.00
Step 9 -- Gain in year two. $14,427.00 - $12,011.24 = $2,415.75
Step 10 -- Cumulative gain after two years. $2,011.24 + $2,415.75 = $4,427.00
The same rate produced $404.51 more in year two than in year one purely because it was applied to a larger base. Three more years of that lands exactly on $25,000.
Adjusting for What the Money Buys
Step 11 -- Real CAGR after 2.5% inflation. (1.2011 / 1.025) - 1 = 17.18%
Step 12 -- The investment multiplier. $25,000 / $10,000 = 2.50x
Step 13 -- Doubling time, Rule of 72. 72 / 20.11 = 3.6 years
Steps 4 and 3 are the pair worth separating. "Up 150%" and "20.11% a year" describe the identical result, and only the second can be set beside a bond yield or an index return. Step 11 then removes roughly three points of that as inflation, which is the difference between growing wealth and growing numbers.
What This Does Not Account For
- Volatility and drawdown risk along the way. CAGR only looks at the start and end points; two investments with identical CAGR can have wildly different risk profiles if one grew smoothly and the other swung through a severe drawdown in between.
- Interim cash flows. If you added or withdrew money during the holding period (dollar-cost averaging into a position, or partial withdrawals), CAGR calculated from just the beginning and ending balance will misrepresent the true return; that scenario calls for a money-weighted return measure like XIRR instead.
- Taxes and fees. The beginning and ending values you enter are assumed to be net figures; the calculator does not separately deduct capital gains taxes, fund expense ratios, or transaction costs.
- Fractional or partial final years. The years input should reflect the exact holding period, including fractions like 2.5 years; rounding a holding period to the nearest whole year will distort the annualized rate, particularly over short horizons.
- Sequence-of-returns risk. Two paths with the same start, end, and CAGR can produce very different outcomes for an investor making regular contributions or withdrawals, because the order in which gains and losses occur matters when cash is moving in or out.
Common Pitfalls
- Averaging annual percentage returns instead of compounding them. Simple arithmetic averaging of, say, +50% and −50% gives 0%, when the true two-year outcome is a 25% loss (up 50% then down 50% from the higher base). CAGR avoids this trap by construction; a manual average does not.
- Using CAGR to project future performance with false confidence. CAGR describes what happened over a specific historical window; it is not a guarantee or even a strong predictor of the rate going forward, especially over short or unusually strong/weak historical periods.
- Ignoring the real (inflation-adjusted) figure when comparing across different eras. A 20% nominal CAGR during a high-inflation decade buys meaningfully less than a 20% nominal CAGR during a low-inflation decade; the real CAGR field exists specifically to make that comparison fair.
- Cherry-picking the start and end dates. CAGR is highly sensitive to the choice of beginning and ending points; starting the measurement right after a market bottom or ending it right at a peak can make an otherwise ordinary growth rate look exceptional.
- Confusing the investment multiplier with the annual rate. A 2.50x multiplier over 5 years does not mean a 50% annual rate; it means a 20.11% annual rate that compounds to 2.5 times the starting value by year five.
Frequently Asked Questions
How is CAGR different from average annual return?
Can CAGR be negative?
Why does the calculator ask for an inflation rate if I only care about nominal growth?
Is the Rule of 72 doubling time exact?
What holding periods is CAGR most useful for?
Sources
- CFA Institute, Level I curriculum on geometric mean returns and time-weighted performance measurement. cfainstitute.org
- U.S. Securities and Exchange Commission, investor education materials on annualized return reporting. sec.gov
- Federal Reserve Bank of St. Louis (FRED), historical CPI data used for real-return inflation adjustment. bls.gov/cpi
- U.S. Securities and Exchange Commission, Investor.gov, the official authority for the investing this calculator relates to. investor.gov
Also consulted: Global Investment Performance Standards (GIPS), guidance on compound annualized return calculation.