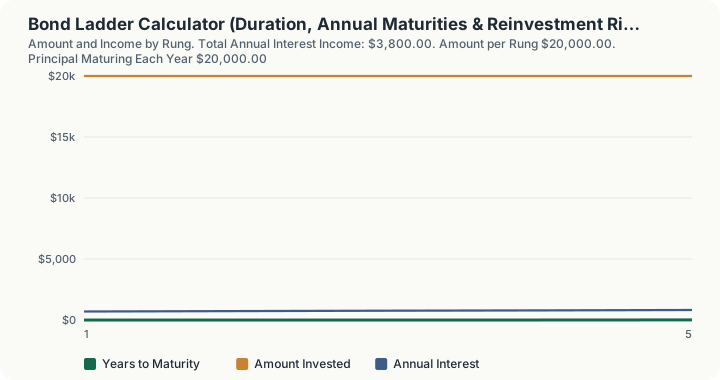
Quick Answer: $100,000 split evenly across five rungs maturing in 1 to 5 years, on a curve starting at 3.50% and rising 0.15 points per extra year, produces $3,800.00 of annual interest income at an average yield of 3.80%. One rung ($20,000) matures every year, so only 20.00% of the portfolio reprices in any one year, against 100% for a single bullet, and the ladder gives up 0.30 points of yield, or $300 a year, versus buying the 5-year alone.
What does this calculator do?
A bond ladder splits a fixed-income portfolio evenly across staggered maturities. One rung matures each period, returning principal that can be spent or reinvested at the long end without ever selling a bond into the market.
Marketing copy usually sells a ladder as a way to reduce interest-rate risk. That is not quite what the arithmetic shows. Duration is duration: a ladder with an average duration of 2.82 years has roughly the price sensitivity of any other portfolio with a duration of 2.82 years, laddered or not. What a ladder genuinely reduces is reinvestment timing risk. With five rungs, only one fifth of the money is exposed to whatever rate happens to prevail in any single year. A bullet exposes 100% of the principal to the rate on one date, and nobody gets to choose which date that is.
That protection is not free on an upward-sloping curve. Short rungs are funded at short yields, so the ladder's average yield sits below the long bond's. This calculator prices that trade explicitly: the yield given up, the income given up, and the duration bought back in exchange.
Invert the curve and the trade inverts with it. On a downward-sloping curve the short rungs out-yield the long bond, so the ladder earns more income and carries less duration, and the yield given up turns negative.
How is this calculated?
Each rung is priced at par, with its coupon set equal to that rung's yield: the standard convention for a ladder built out of new issues. Rung yields come from a straight line through the curve inputs.
yₖ = y_short + s × (tₖ − t_short); tₖ = t_short + (k − 1) × spacing
Amount per rung = Total/N; Annual interest = ∑_k Total/N × yₖ/100
Step 1: Divide the money evenly. Total investment divided by the number of rungs. Every rung gets the same dollar amount; there is no weighting scheme.
Step 2: Place each rung on the maturity ladder. Rung one sits at the shortest maturity, and each subsequent rung is one spacing interval further out.
Step 3: Read each rung's yield off the linear curve. The shortest yield plus the slope multiplied by the extra years beyond the shortest maturity. A negative slope produces an inverted curve.
Step 4: Compute each rung's annual interest. Amount per rung multiplied by that rung's yield. Since each rung is priced at par, coupon equals yield and the two never diverge.
Step 5: Compute each rung's Macaulay duration. Each rung is run through the standard bond pricer at par with semiannual coupons, and its present-value-weighted average time to cash flow is recorded.
Step 6: Average across the rungs. Yield, maturity and Macaulay duration are each averaged across the rungs. Because every rung holds the same amount, the equal-weighted and dollar-weighted averages are identical.
Step 7: Total the income. The rung interest figures are summed.
Step 8: Compute the repricing share. 100 divided by the number of rungs, in percent. This is the share of the portfolio whose principal comes back for reinvestment in any one year.
Step 9: Price the bullet counterfactual. The entire amount invested in one bond at the ladder's longest maturity, priced at par at that maturity's curve yield. Its yield, interest and Macaulay duration are computed the same way.
Step 10: Report the trade. Bullet yield less average ladder yield gives the yield given up in percentage points; bullet interest less ladder interest gives the annual income given up; bullet duration less ladder duration gives the duration reduction.
Worked Example
Defaults: $100,000, 5 rungs, shortest maturity 1 year, spacing 1 year, shortest yield 3.50%, slope 0.15 points per extra year.
Step 1: Size each rung. $100,000 ÷ 5 = $20,000 per rung
Step 2: Set the maturities. 1, 2, 3, 4 and 5 years: 5 rungs, one maturing each year
Step 3: Read the yields off the curve. 3.50%, 3.65%, 3.80%, 3.95%, 4.10% at the long end
Step 4: Compute the interest on each rung. $20,000 × 3.50% = $700 $20,000 × 3.65% = $730 $20,000 × 3.80% = $760 $20,000 × 3.95% = $790 $20,000 × 4.10% = $820
Step 5: Total the annual income. $700 + $730 + $760 + $790 + $820 = $3,800.00
Step 6: Compute the average yield. $3,800 ÷ $100,000 = 3.80%
Step 7: Compute the average maturity. (1 + 2 + 3 + 4 + 5) ÷ 5 = 3.00 years
Step 8: Compute the average Macaulay duration. Averaging the five par-priced rungs gives 2.82 years, shorter than the 3.00-year average maturity because coupons return cash before maturity
Step 9: Compute the annual repricing share. 100% ÷ 5 = 20.00% of the portfolio each year
Step 10: Price the bullet alternative. $100,000 at the 5-year yield of 4.10% earns $4,100 a year, with a Macaulay duration of 4.57 years
Step 11: Price the trade. Yield given up: 4.10% − 3.80% = 0.30 percentage points Income given up: $4,100 − $3,800 = $300 a year Duration bought back: 4.57 − 2.82 = 1.75 years
So $300 a year is the price of cutting duration by 1.75 years and reducing annual reinvestment exposure from 100% of the portfolio to 20% of it.
What does this calculator not account for?
- Reinvestment itself. The calculator prices the ladder as it stands today. It does not project what the maturing rung is reinvested at, nor roll the ladder forward through time. The repricing share is a measure of exposure, not a forecast.
- Every rung is priced at par. Coupon is set equal to yield on every rung, which is the new-issue convention. A ladder built from seasoned premium or discount bonds will have different durations and a different cash-flow shape.
- The yield curve is a straight line. A single slope input runs from the shortest maturity outward. Real curves have humps, kinks and a steepening or flattening term structure that a linear fit cannot express.
- Credit risk, default and recovery. Every rung repays in full. There is no spread, no rating, no issuer diversification effect.
- Call features, sinking funds and prepayment. Rungs are assumed non-callable and bullet-maturing.
- Taxes and transaction costs. No coupon taxation, no state or municipal treatment, no bid-ask spread or commission on building or rolling the ladder.
- Inflation. All yields and income figures are nominal.
- The bullet comparison is one bond at the long end. It is not a duration-matched bullet. The comparison isolates the ladder-versus-single-maturity choice, not a duration-neutral one.
- Rung count is capped at 30 and coupon frequency is fixed at semiannual for the duration computation.
What mistakes do people make with this?
Believing a ladder cuts interest-rate risk relative to a duration-matched portfolio. It does not. The duration reduction reported here comes from holding shorter paper on average, which you could also do with a single 3-year bond. The distinctive benefit is that no single reinvestment date dominates the outcome.
Ignoring the yield given up. On an upward-sloping curve, laddering costs real income every year. At these defaults it is $300 on $100,000, which is 7.3% of the ladder's total income. That is the price of the structure, and it should be a decision, not an accident.
Assuming more rungs is always better. Extending to ten rungs raises the average yield on an upward curve and halves the annual repricing share, but it also lengthens duration, which is the risk most people ladder to reduce. The two effects pull in opposite directions.
Reading average maturity as duration. The ladder's average maturity here is 3.00 years but its average Macaulay duration is 2.82 years. Coupons return cash before maturity, so duration is always shorter than maturity for a coupon bond.
Forgetting the inverted case. With a negative slope the ladder out-yields the bullet and the yield given up is negative. That is a genuine result of the arithmetic, not an error, and it is the environment in which laddering is close to costless.
Frequently Asked Questions
How many rungs should a bond ladder have?
Does a bond ladder protect against rising rates?
What does a ladder cost on a normal yield curve?
Why is the average duration shorter than the average maturity?
What happens on an inverted yield curve?
Does this calculator model reinvesting the maturing rung?
Sources
- The yield curve, the shortest yield and the slope are user inputs with no authoritative source. No market data is embedded in this page, and the defaults are illustrative only. home.treasury.gov/resource-center/data-chart-center/interest-rates/TextView
- U.S. Securities and Exchange Commission, Investor.gov, the official authority for the investing this calculator relates to. investor.gov
Also consulted: Macaulay duration: D_mac = (∑ₜt⋅PV(CFₜ))/(Price × f), in years, on the semiannual convention used for each rung; Par pricing convention: coupon set equal to yield, so each rung's price equals its face amount.
This page contains no statutory or published data. All figures come from engine/primitives/bond-ladder.ts, which delegates rung and bullet duration to the standard bond pricer in engine/primitives/bonds.ts.