Quick Answer: A discounted cash flow valuation adds up the present value of a company's projected free cash flows over an explicit forecast period, plus the present value of a terminal value representing everything beyond that period, to estimate what the underlying business is worth today.
Overview
Discounted cash flow analysis rests on a simple premise: a business is worth the cash it can generate for its owners over its lifetime, brought back to today's dollars at a rate that reflects the risk of actually receiving that cash. Unlike valuation methods based on comparing a company to its peers (trading multiples, precedent transactions), a DCF is a standalone, fundamentals-driven estimate that depends entirely on the assumptions fed into it: how fast cash flow grows, for how long, and at what discount rate that future cash is worth less than cash in hand today.
Because a company's cash flows theoretically extend indefinitely, most DCF models split the forecast into two pieces. The first is an explicit forecast period, typically five to ten years, where analysts project cash flows year by year based on specific assumptions about growth, margins, and reinvestment. The second is a terminal value, a single lump-sum estimate that captures all cash flows beyond the explicit forecast, usually calculated with a simplified growing-perpetuity formula (the Gordon Growth Model) under the assumption that the business eventually settles into a stable, long-run growth rate.
This calculator uses a single starting free cash flow figure that grows at a constant rate through the forecast period, which is a simplification of how real DCF models are typically built (most professional models forecast revenue, margins, and cash flow drivers separately for each year rather than applying one flat growth rate). It captures the same core mechanics, present value of a forecast stream plus present value of a terminal value, that underpin every DCF, while keeping the inputs manageable for a general-purpose calculator.
How This Is Calculated
Step 1: Project free cash flow for each year of the forecast.
Step 2: Discount each projected year back to present value and sum them.
where r is the discount rate (typically the weighted average cost of capital, or WACC) and n is the number of years in the explicit forecast period.
Step 3: Compute a terminal value at the end of the forecast period using the Gordon Growth (growing perpetuity) formula.
Step 4: Discount the terminal value back to present value.
Step 5: Sum the two present values to get the total enterprise value.
The terminal growth rate must be strictly lower than the discount rate for the Gordon Growth formula to produce a finite, positive value; if terminal growth equals or exceeds the discount rate, the denominator becomes zero or negative, which has no economically meaningful interpretation. This calculator automatically caps the terminal growth rate just below the discount rate if you enter a value that violates this condition, so the model always returns a defined number.
Worked Example
Consider a company with current free cash flow of $10,000,000, expected to grow 8% annually for a 5-year explicit forecast period, discounted at a 10% WACC, with a 2.5% terminal growth rate afterward.
Step 1: Project the five years of free cash flow.
| Year | Free Cash Flow |
|---|---|
| 1 | $10,800,000.00 |
| 2 | $11,664,000.00 |
| 3 | $12,597,120.00 |
| 4 | $13,604,889.60 |
| 5 | $14,693,280.77 |
Step 2: Discount each year at 10% and sum.
Step 3: Compute the terminal value at the end of year 5.
Step 4: Discount the terminal value back five years.
Step 5: Add the two components.
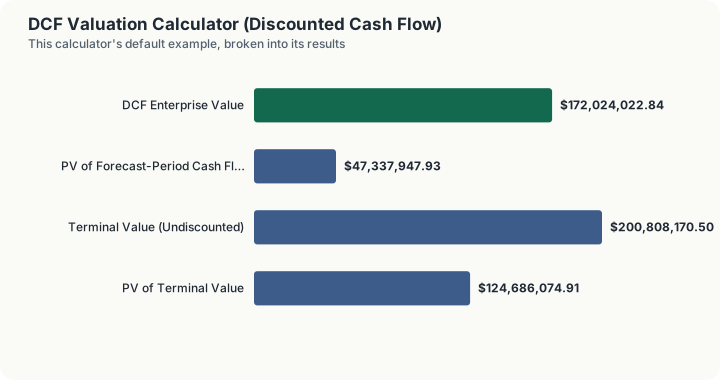
Notice that the present value of the terminal value ($124.7 million) accounts for roughly 72.5% of the total valuation, even though it represents cash flows beyond year five, not the explicit forecast itself. This is completely normal for a standard DCF and is exactly why the terminal growth and discount rate assumptions deserve as much scrutiny as the near-term forecast.
What This Does Not Account For
- A single flat growth rate. Real businesses rarely grow at one constant rate for five straight years; margins expand and compress, competitive dynamics shift, and capital needs change. A single-line growth assumption is a simplification, not a substitute for a full operating model.
- Working capital and capital expenditure detail. This calculator works directly from a free cash flow figure without separately modeling revenue, margins, reinvestment needs, or changes in working capital, which a full DCF build typically breaks out explicitly.
- Capital structure changes. The discount rate is held constant throughout the forecast. In reality, a company's leverage, and therefore its WACC, can shift meaningfully over a multi-year horizon, especially around acquisitions, refinancings, or major capital projects.
- Terminal value sensitivity. Because the terminal value so often dominates the total valuation, small changes in the terminal growth rate or discount rate can swing the output by a large percentage. This calculator does not attempt to reduce that sensitivity; it is inherent to the DCF methodology itself.
- Equity value versus enterprise value. This model outputs enterprise value, the value of the whole business before financing structure. Converting to per-share equity value requires subtracting net debt and other non-operating claims, dividing by shares outstanding, which this calculator does not do.
Common Pitfalls
- Anchoring the terminal growth rate too high. A terminal growth rate above long-run nominal GDP growth (roughly 2-3% in mature developed economies) implies the company eventually grows faster than the entire economy forever, which is not a sustainable long-run assumption for a mature business.
- Choosing a discount rate that does not reflect the company's actual risk. Using a generic "market" discount rate for a highly leveraged or early-stage company, whose cash flows are far riskier than average, will systematically overstate the valuation.
- Over-anchoring on a single point estimate. A DCF's output is only as good as its assumptions; sensible practice is to run a range of growth rate and discount rate scenarios and look at the resulting range of valuations rather than trusting one precise number.
- Ignoring the terminal value's outsized share of total value. When 60-80% of a valuation comes from the terminal value, small, seemingly reasonable tweaks to the terminal growth rate can move the headline number by tens of millions of dollars.
- Forgetting the terminal growth rate must stay below the discount rate. A terminal growth rate at or above the discount rate makes the Gordon Growth formula mathematically undefined or negative; this is a common modeling error that produces nonsensical valuations if not caught.
Frequently Asked Questions
Why does the terminal value make up such a large share of the total valuation?
What discount rate should I use?
What is a reasonable terminal growth rate?
Why use free cash flow instead of net income?
How sensitive is the output to small changes in assumptions?
Sources
- U.S. Securities and Exchange Commission, Investor.gov, the official authority for the investing this calculator relates to. investor.gov
Also consulted: Damodaran, Aswath, "Investment Valuation: Tools and Techniques for Determining the Value of Any Asset," New York University Stern School of Business; Investopedia, "Discounted Cash Flow (DCF) Explained With Formula and Examples"; Corporate Finance Institute (CFI), "Discounted Cash Flow (DCF) Analysis".