Quick Answer: With a risk-free rate of 4.25%, an expected market return of 10%, and a beta of 1.15, the CAPM expected return is 10.86%. That is 4.25% for holding money at all plus 6.61% paid for market exposure, priced off an equity risk premium of 5.75 percentage points. A forecast of 12% sits 1.14 points above the security market line, which is the same as saying you believe the asset's beta ought to be 1.35.
What does this calculator do?
The Capital Asset Pricing Model does one thing: it prices systematic risk and refuses to pay for anything else. Everything specific to a single company is assumed to be diversifiable, and anything a diversified investor can eliminate for free cannot command a return. What is left is exposure to the market as a whole, measured by beta.
That reduction is severe, and it is the point. It means the entire expected return of an asset depends on one coefficient:
E(Rᵢ) = R_f + βᵢ(E(Rₘ) − R_f)
Two consequences follow that this calculator makes explicit. First, at a beta of zero the expected return collapses to the risk-free rate exactly. Any asset priced above the risk-free rate is being compensated for market exposure and nothing else. Second, expected return is linear in beta with a slope equal to the equity risk premium, so the entire sensitivity of the answer to a beta estimation error is one number, and it is the same at every beta level.
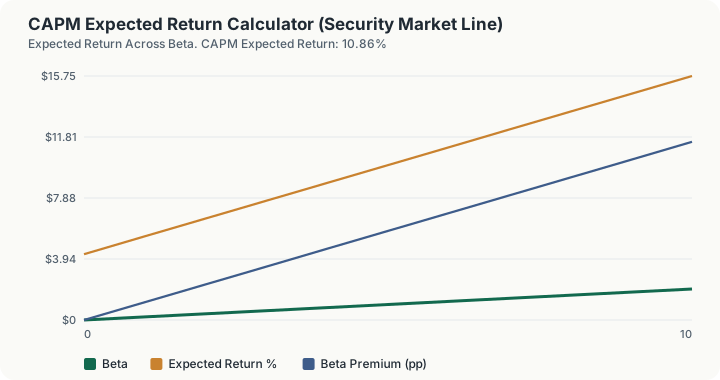
That line is the security market line, and the calculator plots it across eleven betas from 0 to 2. It also lets you enter your own return forecast and reports the gap against the line, which is the mispricing you are implicitly claiming exists, along with the beta that would justify your forecast if the line is right and your beta estimate is wrong.
How is this calculated?
ERP = E(Rₘ) − R_f; Beta premium = β × ERP; E(R) = R_f + β × ERP
Step 1: Compute the equity risk premium. Expected market return less the risk-free rate. This is the slope of the security market line and the price of one full unit of beta.
Step 2: Compute the beta premium. Beta multiplied by the equity risk premium. Beta is a dimensionless coefficient and is never rescaled as a percentage.
Step 3: Add the risk-free rate. The expected return is the risk-free rate plus the beta premium. Nothing else enters.
Step 4: Compute the sensitivity per 0.1 of beta. The equity risk premium divided by ten. Because the line is straight, this figure is identical at every beta level, which is why a beta estimation error costs the same whether beta is 0.3 or 2.3.
Step 5: Compare your own forecast against the line. Your forecast return less the CAPM expected return, in percentage points. A positive figure means you believe the asset sits above the line and is therefore underpriced on your own numbers.
Step 6: Invert the line against your forecast. Your forecast less the risk-free rate, divided by the equity risk premium, gives the beta at which the line would deliver your forecast exactly. It is reported as "N/A" when the equity risk premium is zero, since the line is then flat and no beta produces a different answer.
Step 7: Trace the security market line. The calculator evaluates the same formula at eleven betas from 0.00 to 2.00 in steps of 0.20, reporting the expected return and the beta premium at each. Point zero is the risk-free rate by construction.
The verdict line is chosen by the sign of the gap in step 5, with a small tolerance around zero so that a forecast sitting on the line is reported as fairly priced rather than as a rounding-scale mispricing.
Worked Example
Defaults: risk-free rate 4.25%, beta 1.15, expected market return 10%, own forecast 12%.
Step 1: Find the equity risk premium. 10.00% − 4.25% = 5.75 percentage points
Step 2: Price this asset's market exposure. 1.15 × 5.75% = 6.61 percentage points
Step 3: Add the risk-free rate to get the required return. 4.25% + 6.6125% = 10.86%
Step 4: Find how much a small beta error would cost. 5.75 ÷ 10 = 0.575 percentage points per 0.1 of beta
Step 5: Compare your forecast against the line. 12.00% − 10.8625% = 1.14 percentage points above the line
Step 6: Find the beta your forecast implies. (12.00% − 4.25%) ÷ 5.75% = 1.35
Step 7: Check the anchor points of the line. At beta 0: 4.25% + (0 × 5.75%) = 4.25%, the risk-free rate exactly At beta 1: 4.25% + (1 × 5.75%) = 10.00%, the market return exactly At beta 2: 4.25% + (2 × 5.75%) = 15.75%
Step 4 is the one worth dwelling on. If your beta estimate is off by 0.2, entirely plausible given how much beta moves with the estimation window, the required return moves by 1.15 points, which is more than the entire mispricing you found in step 5. The claim in step 5 is smaller than the measurement error in the input that produced it.
What does this calculator not account for?
- Every input is an assumption with no authority. The risk-free rate, the expected market return and beta are all supplied by you. No market data, no survey, and no published estimate is embedded in this page. The defaults are illustrative and are not a recommendation.
- The expected market return is unobservable. Historical realised returns are not expected returns, and reasonable practitioners disagree about the equity risk premium by more than the mispricings people use CAPM to detect.
- A single factor. There is no size, value, momentum, profitability, quality or liquidity factor here. Empirical work has documented returns CAPM does not explain for decades; alpha in this model absorbs all of them.
- Beta is an input, not an estimate. The calculator does not regress returns on anything. It cannot tell you whether your beta was measured on daily or monthly data, over one year or five, or against a benchmark that matches your holding.
- A single period. There is no term structure of risk premia, no time-varying beta and no compounding of expected returns over multiple horizons.
- No taxes, costs or borrowing constraints. CAPM assumes you can lend and borrow freely at the risk-free rate, which is not a description of any real market.
- The security market line table is capped at a beta of 2.00, but the beta input itself accepts values from −2 to 4.
- This is not investment advice. A gap against the line is a statement about your own assumptions, not a signal.
What mistakes do people make with this?
Treating the CAPM output as a forecast. It is a required return, not a prediction. It tells you what the asset would have to return to compensate for its market risk at your assumed premium, which is a benchmark to judge a forecast against, not a forecast itself.
Using a historical average as the expected market return. Realised returns include valuation changes that are not repeatable. Feeding a decade of strong realised returns into the model inflates the equity risk premium and therefore raises every required return you compute.
Ignoring how sensitive the answer is to beta. At these inputs, each 0.1 of beta is worth 0.575 percentage points of required return. Beta estimates routinely move by more than 0.2 depending on the window and frequency chosen, and that alone can swamp any mispricing.
Forgetting that beta scales the premium, not the whole return. A beta of 1.15 does not mean 1.15 times a 10% market return. It means the risk-free rate plus 1.15 times the 5.75-point premium. Getting this wrong overstates the required return by more than four percentage points here.
Expecting a negative-beta asset to be attractive. A negative beta produces a required return below the risk-free rate, because an asset that rises when the market falls is insurance and you pay for insurance. At a beta of −0.4 the required return is 1.95%. That is a feature of the model, not a bug.
Confusing beta with volatility. Beta measures co-movement with the market, not total risk. A wildly volatile stock whose moves are uncorrelated with the market has a low beta and, under CAPM, a low required return.
Frequently Asked Questions
What is the security market line?
What does it mean if my forecast is above the security market line?
What equity risk premium should I use?
Why does a beta of zero give exactly the risk-free rate?
Can expected return be below the risk-free rate?
Is CAPM still used if it has been empirically challenged?
Sources
- U.S. Securities and Exchange Commission, Investor.gov, the official authority for the investing this calculator relates to. investor.gov
Also consulted: CAPM expected return: E(Rᵢ) = R_f + βᵢ(E(Rₘ) − R_f); Equity risk premium: expected market return less the risk-free rate; the slope of the security market line; Sensitivity per 0.1 of beta: the equity risk premium divided by ten, constant at every beta because the relationship is linear; Implied beta: (forecast return − risk-free rate) / equity risk premium; Risk-free rate, expected market return, beta and your own forecast are user inputs with no authoritative source.
This page contains no statutory or published data. CAPM is a closed-form model, implemented in engine/primitives/returns.ts (capmExpectedReturn, securityMarketLine) and covered by golden vectors.