Quick Answer: The Sortino Ratio measures how much return a portfolio earned above a target rate for every unit of downside risk it took on, ignoring upside swings entirely, so it rewards volatility that comes from gains and only penalizes volatility that comes from losses.
Overview
The Sortino Ratio was developed to fix a specific flaw in the more famous Sharpe Ratio. Sharpe divides excess return by total standard deviation, treating every swing away from the average, up or down, as equally undesirable. That is a strange assumption for most investors. Nobody complains about a portfolio that occasionally jumps 25% in a good quarter. What actually worries investors is the chance of losing money, or falling short of a minimum acceptable return.
Frank Sortino's answer was to redefine risk as downside deviation: the standard deviation calculated using only the returns that fall below a chosen target, called the Minimum Acceptable Return, or MAR. Everything above the target is left out of the risk calculation entirely, even if it was a huge positive outlier. The result is a ratio that more closely matches how most people actually think about risk, as the chance of bad outcomes rather than the chance of any deviation from average.
This calculator takes a short series of period returns, lets you set the MAR, and computes both the Sortino Ratio and the underlying downside deviation, alongside the ordinary standard deviation of the full series so you can see exactly how much the two risk measures diverge for a given return pattern.
How This Is Calculated
The Sortino Ratio formula is:
Sortino Ratio = (Average Return − Target Return) / Downside Deviation
Downside deviation is computed as follows. For each period's return, subtract the target return. If the result is positive (the period beat the target), it contributes zero to the risk calculation. If the result is negative (the period fell short of the target), square that shortfall. Average the squared shortfalls across every period in the series (not just the losing ones), then take the square root:
Downside Deviation = √( Σ [min(0, Return − Target)]² / n )
Notice the denominator is the total number of periods, n, not just the number of losing periods. This is a deliberate design choice in the standard formula: a series with two bad quarters out of six is treated as less risky than a series with the same two bad quarters out of only three, because the losses are diluted across more good periods.
The engine underneath this calculator implements this exact formula as calculateSortinoRatio(), operating on fractional returns (0.20 for 20%) rather than raw percentage points, and the calculator converts every percentage input to a fraction before calling it.
Worked Example
Suppose an investor tracks six annual returns for a portfolio: +20%, −10%, +15%, −5%, +25%, and +10%, with a Minimum Acceptable Return of 0%.
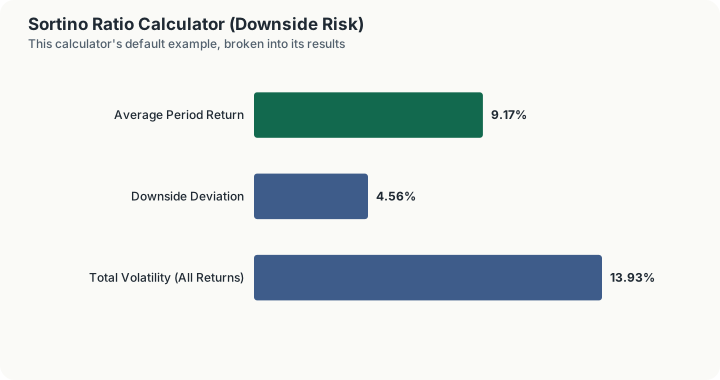
Step 1: Average return. (0.20 − 0.10 + 0.15 − 0.05 + 0.25 + 0.10) / 6 = 0.55 / 6 = 0.091667, or 9.1667%.
Step 2: Isolate the downside periods. Only two years fall below the 0% target: −10% and −5%. Every other year contributes zero to the risk calculation, no matter how large the gain was.
Step 3: Square and average the shortfalls. (−0.10)² + (−0.05)² = 0.01 + 0.0025 = 0.0125. Divide by all six periods: 0.0125 / 6 = 0.0020833. Take the square root: √0.0020833 = 0.0456435, or 4.5644%. This is the downside deviation.
Step 4: Divide. 0.091667 / 0.045644 = 2.0083.
The Sortino Ratio for this portfolio is approximately 2.01. For comparison, the ordinary standard deviation of the same six returns (used by the Sharpe Ratio instead) is about 13.93%, roughly three times larger than the downside deviation. That gap illustrates exactly why the two ratios can tell very different stories about the same portfolio: most of this portfolio's volatility came from strong up years, which Sortino ignores as risk and Sharpe does not.
What This Does Not Account For
This calculator computes the Sortino Ratio mechanically from the return series and target you provide. It does not account for the following.
- Sample size. A ratio built from six annual returns carries a lot of statistical noise. Institutional Sortino calculations typically use 36 to 60 monthly observations for more stability.
- Serial correlation. The formula assumes each period's return is independent of the last. Momentum or mean-reversion effects in the underlying returns are not modeled.
- Fees, taxes, and trading costs. Enter net-of-fee returns if you want a ratio that reflects what an investor actually keeps.
- Fat tails. Downside deviation still treats the return distribution as roughly well-behaved. A portfolio with rare but catastrophic losses (a "black swan" exposure) can show a deceptively strong Sortino Ratio right up until the tail event happens.
- Choice of MAR. The ratio is highly sensitive to the target you pick. A 0% MAR, a risk-free rate MAR, and an inflation-linked MAR can produce meaningfully different rankings between funds.
Common Pitfalls
- Comparing Sortino Ratios computed with different MARs. A ratio calculated against a 0% target is not comparable to one calculated against a 5% target. Always confirm the MAR before comparing two funds' published Sortino figures.
- Mixing return frequencies. Comparing a Sortino Ratio built from monthly returns to one built from annual returns without annualizing both first will produce a misleading comparison, since downside deviation does not scale linearly with the number of periods.
- Treating a small positive Sortino as automatically good. A Sortino Ratio above 1.0 is often cited as respectable and above 2.0 as strong, but these thresholds vary a great deal by asset class and time horizon. A bond fund and a small-cap equity fund should not be judged against the same bar.
- Ignoring the "no downside" edge case. If every single period beats the target, downside deviation is mathematically zero and the ratio becomes undefined, or in this calculator's case is shown as a capped sentinel value (99.99) to signal "no downside observed" rather than an error. This does not mean the strategy has zero risk going forward.
- Forgetting that Sortino still rewards volatility, just not downside volatility. A fund that swings wildly upward will show a low downside deviation and a very attractive Sortino Ratio, even though many investors would still call that fund risky in a practical sense.
Frequently Asked Questions
How is the Sortino Ratio different from the Sharpe Ratio?
What Minimum Acceptable Return (MAR) should I use?
What counts as a "good" Sortino Ratio?
Can the Sortino Ratio be negative?
Why does this calculator ask for individual period returns instead of a single average return and standard deviation?
Does a higher Sortino Ratio always mean a better investment?
Sources
- CFA Institute Curriculum: Quantitative Investment Analysis, Risk-Adjusted Performance Measures. cfainstitute.org
- Sortino, F. A. and Price, L. N. (1994), "Performance Measurement in a Downside Risk Framework," The Journal of Investing. The downside-deviation measure the ratio uses. doi.org/10.3905/joi.3.3.59
Also consulted: Sortino, F.A. and van der Meer, R. (1991). "Downside Risk." Journal of Portfolio Management.; Sortino, F.A. and Price, L.N. (1994). "Performance Measurement in a Downside Risk Framework." Journal of Investing.; Chicago Mercantile Exchange, Pension Research Institute publications on downside risk-adjusted performance measurement.