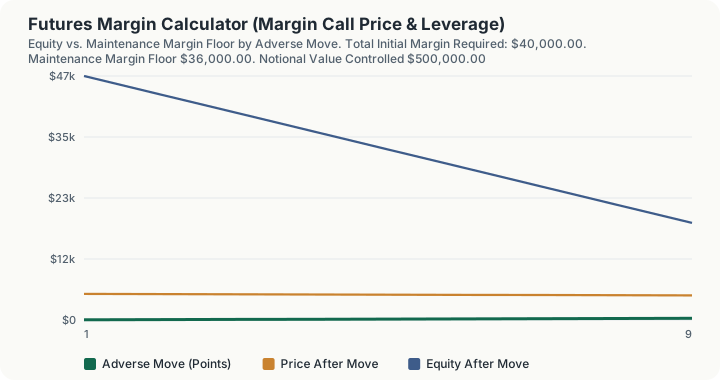
Quick Answer: Futures margin is a fixed dollar amount per contract set by the exchange's clearing house, not a percentage of notional value. Two contracts at $20,000 initial and $18,000 maintenance margin each require $40,000 to open and must keep equity above $36,000. With $50,000 in the account and a $50 multiplier, the position earns or loses $100 per point, can absorb $14,000 (140 points) of adverse movement, and gets a margin call if an ES-style price of 5,000 falls to 4,860.
Overview
Futures are leveraged by design: you control a large notional position while posting a comparatively small performance bond. What trips up most people using a margin calculator is the shape of that requirement. Exchanges do not say "post 8% of notional." CME Clearing, Cboe Futures Exchange, and ICE each publish a specific dollar figure per contract per product, and your broker applies that figure (or a higher one) to every contract you hold. The E-mini S&P 500 has its own initial and maintenance dollar amounts; the Micro E-mini has smaller ones; Crude Oil, Gold, and the Treasury futures each have their own. This calculator therefore asks for the numbers the exchange actually publishes, contracts held, dollars of initial and maintenance margin per contract, the contract multiplier, the current price, and your account equity, and returns your total requirement, leverage, dollars per point, and the exact price at which a margin call fires.
How This Is Calculated
Total margin requirement. Margin scales linearly with contract count for a single-product position:
Notional value is derived, not the basis of the requirement. It is what the position controls:
The multiplier is the dollar value of one full point of the quoted price: $50 per index point for the E-mini S&P 500 (ES), $5 for the Micro E-mini (MES), 1,000 barrels for Crude Oil (CL), 100 troy ounces for Gold (GC). Because the exchange's dollar margin is fixed while notional moves with price, the implied margin percentage drifts continuously, which is precisely why modelling margin as a percentage of notional gives the wrong answer. The calculator reports that percentage only as a descriptive by-product.
Leverage ratio measures notional exposure per dollar of margin posted:
Dollars per point converts price movement into account P&L:
Loss capacity and the margin call trigger price. A call fires when account equity falls below the maintenance floor. The loss the account can absorb first is the gap between equity and that floor, which, when you have posted exactly the initial requirement, reduces to the textbook (initial − maintenance) buffer, and is larger when you keep extra cash in the account:
For a long position (which loses as price falls) the trigger sits below the current price; for a short (which loses as price rises) it sits above:
Hypothetical scenario. For your entered adverse move in points, the loss is (points × $ per point), equity after the move is that loss debited from your equity as variation margin, and a call is flagged when the result sits below the maintenance floor. The cash then due restores the account to the initial requirement, not merely back to maintenance, so the calculator reports (initial margin − remaining equity), not (maintenance − remaining equity).
Worked Example
A long two-lot ES-style position: $20,000 initial and $18,000 maintenance margin per contract, a $50 multiplier, the index at 5,000, and $50,000 of account equity. The step ladder below follows the position down through an adverse move rather than jumping straight to the answer.
Step 1 -- Total initial margin. 2 x $20,000 = $40,000
Step 2 -- The maintenance floor. 2 x $18,000 = $36,000
Step 3 -- Notional value controlled. 2 x $50 x 5,000 = $500,000
Step 4 -- Leverage. $500,000 / $40,000 = 12.50x Initial margin as a share of notional: 8.00%, a figure that drifts tomorrow purely because the index moved
Step 5 -- Dollars per point. 2 x $50 = $100 per index point
Step 6 -- Loss capacity before a call. $50,000 equity - $36,000 floor = $14,000
Step 7 -- Convert that into price. $14,000 / $100 = 140 index points
Step 8 -- The margin call trigger price for a long. 5,000 - 140 = 4,860
Walking the position down
Step 9 -- Down 35 points, one quarter of the buffer. Price: 4,965. Equity: $46,500. Call: no
Step 10 -- Down 70 points. Price: 4,930. Equity: $43,000. Call: no
Step 11 -- Down 105 points. Price: 4,895. Equity: $39,500. Call: no
Notice that equity is already below the $40,000 initial requirement at step 11 and nothing has happened. The initial figure is what you need to open the position; only the $36,000 maintenance floor triggers anything.
Step 12 -- Down 140 points, exactly at the floor. Price: 4,860. Equity: $36,000. Call: no, but there is no room left
Step 13 -- Down 175 points. Price: 4,825. Equity: $32,500. Call: yes
Step 14 -- The entered 150-point adverse move. Loss: 150 x $100 = $15,000 Price: 4,850. Equity: $50,000 - $15,000 = $35,000 Call triggered: yes
Step 15 -- Cash required to meet it. $40,000 - $35,000 = $5,000
A met call restores the account to the initial requirement, not merely back to the maintenance floor. The index moved 3% and the account owes fresh cash.
What the excess equity was buying
Step 16 -- The identical position funded at exactly the initial requirement. Equity: $40,000. Loss capacity: $40,000 - $36,000 = $4,000 Max adverse move: $4,000 / $100 = 40 points Trigger price: 4,960 The same 150-point move now demands $15,000 of fresh cash rather than $5,000
Steps 6 and 16 describe the same contracts, the same multiplier and the same exchange margins. The only difference is $10,000 of cash sitting idle in the account, and it moves the trigger from 4,860 to 4,960, from a move most sessions do not produce to one that many do.
Step 17 -- The mirror image, sold short. Loss capacity and max adverse move are unchanged at $14,000 and 140 points Trigger price: 5,000 + 140 = 5,140, and the 150-point adverse move takes the price to 5,150
A short loses as price rises, so the trigger sits above the market rather than below it. Every other number in the calculation is identical.
SPAN and SPAN 2: Where the Dollar Figures Come From
The per-contract dollar amounts you type into this calculator are outputs of a portfolio risk model, not a policy percentage. CME Clearing has for decades used SPAN (Standard Portfolio Analysis of Risk), a scenario-based margin system: for each product it defines a risk array, typically sixteen scenarios combining underlying price moves up and down across a defined "scan range" with volatility shifts up and down, revalues the position under every scenario, and takes the worst-case loss as the scan risk. On top of that it adds charges for intra-commodity spread risk between expiry months and delivery-month risk, and subtracts credits for offsetting inter-commodity positions. The published initial and maintenance figures for a single outright contract are what that machinery produces for a one-lot.
CME is migrating that framework to SPAN 2, which keeps the scenario logic but layers on a value-at-risk-based core with explicit add-ons for liquidity, concentration, and stress risk, and applies them consistently across futures and options in the same portfolio. The practical consequences for a trader are the same under either model, and they matter more than the model's internals:
- Requirements move with volatility. When realized or implied volatility rises, the scan range widens and the dollar requirement goes up, often mid-crisis, exactly when your account can least afford it, and sometimes with only a day's notice. A requirement that was comfortable when you opened the position can be binding a week later without you trading at all.
- Portfolio offsets are real but not available in this tool. A calendar spread or a hedged basket margins far below the sum of its legs under SPAN. This calculator models a flat, single-product position, so for spreads or mixed portfolios it will overstate the requirement; use your broker's SPAN calculation for those.
- The published figure is a floor, not a ceiling. Brokers routinely apply a multiple of exchange minimums to retail accounts, and raise it further around known event risk or contract expiry.
Because the figures are revised periodically, this calculator deliberately does not bake in a table of product margins that would go stale. Look up the current number for your product on the exchange's performance bond page or in your broker's margin table and enter it.
Overnight vs. Day-Trade Margin
The exchange requirement described above is the overnight, or initial, requirement: it is what you must have to carry a position through the daily settlement window into the next session. Many futures brokers separately offer a much smaller day-trade margin, sometimes a small fraction of the overnight figure, for positions opened and closed within the same session.
That reduction is a broker credit policy, not an exchange rule. The broker's reasoning is that an intraday position it can force-liquidate before the close carries less overnight gap risk to the broker, so it will extend more leverage against it. Three things follow:
- The relief evaporates at a fixed clock time. Brokers publish a cutoff before settlement; any position still open then must be covered at the full overnight requirement, or the broker's risk desk liquidates it. Traders who size a position on the day-trade number and then decide to hold it overnight are the classic margin-call case.
- Day-trade leverage does not change the risk of the position. The same contract loses the same dollars per point regardless of how much margin your broker required to open it. A day-trade margin one-fifth the overnight figure means an adverse move consumes your equity five times as fast in percentage terms.
- Brokers withdraw it unilaterally. Day-trade margin is commonly suspended around major economic releases, contract rollover, and high-volatility regimes.
To model a day-trade position here, enter the broker's day-trade figure as the initial margin per contract and its associated intraday maintenance figure, but check what the position would require at the overnight number before assuming you can hold it.
What This Does Not Account For
- Mark-to-market timing. Futures accounts are marked to market daily, and intraday for volatile products. This is a static snapshot, not the path of gains and losses session by session.
- Portfolio and spread offsets. SPAN margins a portfolio, not a list of positions. Calendar spreads, inter-commodity spreads, and hedged option/futures combinations all margin below the sum of their parts; this tool models one product, flat.
- Requirement changes over the life of the trade. The per-contract dollar figures you enter are treated as fixed; in reality the clearing house revises them as volatility changes.
- Tick rounding. Losses are computed continuously in price points; real contracts trade in discrete tick increments (ES in 0.25 index-point ticks worth $12.50, for example), so an exact trigger price will in practice be reached at the nearest tradeable tick.
- Settlement and delivery mechanics. Physical delivery, cash settlement procedure, delivery-month margin escalation, and expiration effects are out of scope.
Common Pitfalls
- Treating margin as a percentage of notional. It is a published dollar amount per contract. Any tool or rule of thumb that applies a fixed percentage to notional will be wrong as soon as price moves away from the level at which the percentage was inferred, and wrong across products entirely.
- Confusing initial margin with maximum loss. Initial margin is a good-faith performance bond, not a cap. Losses on a futures position can and do exceed it, which is exactly what a margin call demands you cover.
- Sizing to the initial requirement with no cash cushion. Posting exactly initial margin leaves only the (initial − maintenance) gap as your entire buffer, in the worked example, 40 points. Excess equity is what keeps ordinary volatility from producing a call.
- Assuming a met call restores you to maintenance. It restores you to the initial requirement, which is a meaningfully larger deposit than the shortfall against the floor.
- Treating the trigger price as a stop-loss. A margin call is a demand for capital, not an exit. If it goes unmet the broker liquidates at the prevailing market price, which in a fast market can be considerably worse than the trigger.
Frequently Asked Questions
How do exchanges actually publish futures margin?
Why is maintenance margin lower than initial margin?
What actually happens when a margin call is triggered?
Does higher leverage mean higher expected returns?
Can I lose more than my initial margin deposit?
How do I model a micro contract?
Sources
- U.S. Securities and Exchange Commission, Investor.gov, the official authority for the investing this calculator relates to. investor.gov
Also consulted: CME Group, performance bond (margin) requirements and the SPAN / SPAN 2 methodology overview; CME Clearing, risk management and performance bond policy documentation; Cboe Futures Exchange, margin requirements for listed futures products; Commodity Futures Trading Commission (CFTC), futures trading basics and margin overview; Financial Industry Regulatory Authority (FINRA), margin trading and leverage risk disclosures.