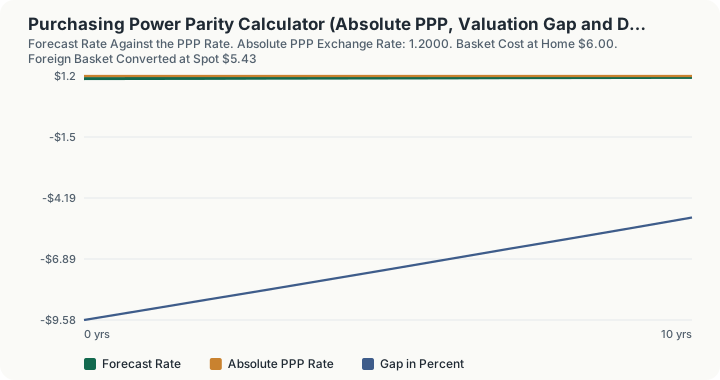
Quick Answer: A basket costing 6.00 at home and 5.00 abroad implies an absolute PPP exchange rate of 1.2000. With spot at 1.0850, the foreign currency is 9.58% cheap against the basket. Projecting spot forward on a 2.5% versus 2.0% inflation differential gives 1.1394 after ten years, which still sits 5.05% below the PPP rate: the drift narrows the gap without closing it, because nothing in relative PPP pulls spot toward absolute PPP.
What does this calculator do?
Purchasing power parity is two different ideas that share a name and get confused constantly.
Absolute PPP compares what one identical basket costs in two currencies right now. Divide the home price by the foreign price and you have the exchange rate at which the basket would cost the same in both places. That is a statement about the present, and the gap between it and spot is the over- or undervaluation that every "burger index" headline reports.
Relative PPP projects the exchange rate forward on the inflation differential. The currency with the higher inflation loses value against the other at roughly the difference between the two rates. That is a statement about drift, and crucially it starts from wherever spot happens to be, misvalued or not.
The two only agree if spot already sits at absolute PPP. Otherwise relative PPP simply carries the existing misvaluation forward, which is why this page computes both and reports the gap between them rather than presenting either as "the PPP rate".
All rates here are quoted as units of the domestic currency per one unit of the foreign currency. For a US reader pricing the euro, that is dollars per euro.
How is this calculated?
- Divide the domestic basket price by the foreign basket price. This is the absolute PPP rate. It depends on nothing else: not on spot, not on inflation, not on the horizon.
PPP = P_domestic/P_foreign
- Measure spot against that rate as a percentage. A negative figure means the foreign currency buys less at home than the basket comparison says it should, so the foreign currency is cheap.
Gap = (S₀/PPP − 1) × 100
- Convert the foreign basket into domestic currency at spot. The foreign price multiplied by the spot rate, shown beside the domestic price. The gap between those two money figures is the same valuation gap expressed in currency rather than in percent.
- Project spot forward on the inflation differential. This is relative PPP, compounded over the horizon you enter. Note the starting point: it is spot, not the PPP rate from step 1.
Sₜ = S₀ × ((1 + π_domestic)/(1 + π_foreign))ᵗ
- Measure the projected rate against the absolute PPP rate, using the same comparison as step 2 applied to the forecast instead of to spot.
- Compare the two gaps in absolute size to report whether the drift narrows or widens the misvaluation. This is a comparison of the outputs of steps 2 and 5, not a separate model.
The table repeats steps 4 and 5 at even fractions of your horizon, so the path of the projected rate against the fixed PPP rate is visible year by year.
Worked Example
A basket costs 6.00 at home and 5.00 abroad. Spot is 1.0850. Domestic inflation is 2.5%, foreign inflation 2.0%, and the horizon is ten years.
Step 1: The absolute PPP rate. $6.00 / 5.00 =$ 1.2000
At 1.2000, the basket would cost the same in both places.
Step 2: Spot against it. $1.0850 / 1.2000 = 0.904167$, so the gap is -9.58%
The foreign currency is cheap by nearly ten percent on this comparison.
Step 3: The same statement in money. The basket costs 6.00 at home. Bought abroad for 5.00 and paid for at spot it costs $5.00 \times 1.0850 =$ 5.43.
Same fact, no percentages: the identical basket is 57 cents cheaper abroad, which is 9.58% of 6.00. This is the entire content of a burger index headline, and it is a price comparison rather than a forecast.
Step 4: Project spot forward ten years. The annual drift factor is $1.025 / 1.020 = 1.004902$
$1.0850 \times 1.004902^{10} = 1.0850 \times 1.050115 =$ 1.1394
Step 5: The projected rate against PPP. $1.1394 / 1.2000 - 1 =$ -5.05%
Step 6: What that means. The gap narrowed from 9.58% to 5.05% over a decade, but it did not close. Relative PPP contains no force pulling spot back to absolute PPP; it only applies the inflation differential to wherever spot already is. If you want convergence, you have to assume it separately, and that assumption is doing all the work.
Now the cases that make the distinction sharp.
Step 7: Start from parity instead. Set spot to 1.2000. The valuation gap is 0.00%, and from then on the projected rate and the PPP rate move together, because the only thing separating them was the initial misvaluation.
Step 8: Reverse the inflation differential. With domestic inflation at 2.0% and foreign at 2.5%, the factor becomes $1.020 / 1.025 = 0.995122$, and ten years gives $1.0850 \times 0.952276 =$ 1.0332. The foreign currency drifts cheaper, and the gap against PPP widens rather than narrows.
Step 9: A differential large enough to matter. Raise foreign inflation to 12%. The annual factor is $1.025 / 1.12 = 0.915179$, and over ten years $1.0850 \times 0.412153 =$ 0.4472. The foreign currency loses 59% of its value.
This is where relative PPP earns its keep. Across countries with inflation differentials in double digits it explains most of the nominal exchange rate movement. Across advanced economies with a half point differential it explains almost none of it, and the noise dwarfs the signal for years at a time.
Step 10: Stretch the horizon. Over thirty years the modest 0.5 point differential compounds to $1.0850 \times 1.157959 =$ 1.2564, which finally passes the PPP rate. The evidence for PPP is a long-horizon result, and ten years is on the short side of where it starts to bite.
What does this calculator not account for?
- Whether the baskets are genuinely comparable. This is the largest source of error and it is entirely on the user. Two baskets differing in quality, size, taxation or local input costs produce a PPP rate that measures those differences rather than currency valuation.
- Non-traded goods. Haircuts, rent and local services cannot be arbitraged across borders. Their prices reflect local wages, which is why richer countries show persistently higher price levels and appear permanently overvalued on PPP.
- Tariffs, transport and sales taxes. All three wedge prices apart without any currency implication. A basket compared inclusive of one country's VAT and exclusive of another's is not a currency comparison.
- Any timing. Nothing here says when spot might move toward PPP, or whether it ever will. The horizon input governs the inflation projection only.
- Interest rates. A tradeable forward price comes from the interest rate differential, not the inflation differential. That is covered interest parity, a different calculation with a different status.
- Productivity trends. The Balassa-Samuelson effect predicts that fast-growing economies see their real exchange rates appreciate persistently, so the PPP rate itself moves.
- Capital flows, policy and sentiment. These dominate exchange rates over months and years, and PPP says nothing about any of them.
- Compounding convention. The projection uses discrete annual compounding of the inflation ratio, not the common approximation of subtracting one inflation rate from the other.
What mistakes do people make with this?
- Treating absolute PPP as a forecast. It is a price comparison. A currency can sit 20% away from PPP for a decade, and many do.
- Getting the sign backwards. Here a negative gap means the foreign currency is cheap, because fewer domestic units are being paid per foreign unit than the baskets imply. Check the direction against the money figures in step 3 whenever the wording feels ambiguous.
- Mixing quote conventions. Everything on this page is domestic units per foreign unit. Entering spot one way round and the basket prices the other produces a gap that is confidently wrong.
- Using a headline consumer price index to compare price levels. An index is a level with an arbitrary base, not a price. Absolute PPP needs actual prices of an actual basket.
- Subtracting inflation rates instead of taking the ratio. At a half point differential the approximation is harmless. At 12% against 2.5% it is not: subtraction gives a 9.5% annual drift where the correct factor implies 8.48%.
- Expecting relative PPP to close the valuation gap. It cannot, by construction. Step 6 is the point of the page.
- Applying PPP to a single traded commodity. One item is a basket of one, and its price gap tells you about that item's supply chain far more than about the currency.
Frequently Asked Questions
What is the difference between absolute and relative PPP?
Does PPP predict exchange rates?
Why do rich countries always look overvalued?
What basket should I use?
Is the PPP rate the same as the forward rate?
Why does the ten year projection still sit below the PPP rate?
Sources
- U.S. Securities and Exchange Commission, Investor.gov, the official authority for the investing this calculator relates to. investor.gov
There is no statutory or regulatory source for these formulas, and none is invented here. Absolute purchasing power parity as the ratio of two basket prices, and relative purchasing power parity as the compounded ratio of two inflation rates applied to spot, are standard results in international economics rather than legal constructs. Published PPP conversion factors exist, notably those produced by the International Comparison Program for national accounts work, but those are estimates built from surveyed price data for a specific basket and this calculator does not reproduce or claim to implement any of them: the basket prices here are the ones you enter.
The implementations are absolutePppRate, pppValuationGapPercent and pppExchangeRateForecast in engine/primitives/fx.ts, proven against hand-derived vectors in engine/vectors/fx.test.ts and in this calculator's own vectors.test.ts. Related pages: the currency forward rate calculator for the tradeable arbitrage-enforced rate that PPP is often mistaken for, the cross rate calculator for building a pair from two dollar quotes, and the inflation calculator for the price level changes that drive the drift here.