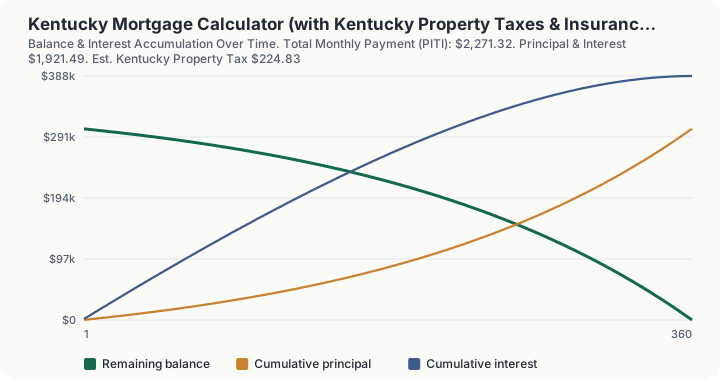
Quick Answer: On a $380,000 Kentucky home with 20% down and a 6.5% rate, expect a total monthly payment (PITI) of about $2,271.32, including roughly $224.83 a month in Kentucky property tax.
Overview
Kentucky runs one of the lower effective property tax burdens in the country, with a statewide constitutional cap limiting how fast real property assessments can grow the total tax revenue collected (House Bill 44's 4% revenue growth cap has, since 1979, kept nominal rates from climbing as fast as property values in many taxing districts). The result, confirmed by Kentucky Department of Revenue data, is a statewide effective residential rate close to 0.71% of market value, the figure this calculator uses. That places Kentucky in similar territory to Indiana and well below higher-tax neighbors like Iowa on an identically priced home.
Kentucky property tax is levied by multiple overlapping authorities, the state itself, county, city, school district, and sometimes special districts (fire, library, health), each certifying its own rate annually, but the 4% revenue growth cap constrains how much most of these entities can increase total collections year over year without a public vote, a structural brake that keeps Kentucky's effective rate comparatively stable and low relative to states without such a cap. Rates still vary somewhat by county: Jefferson County (Louisville) and Fayette County (Lexington) carry somewhat different total rates than smaller rural counties due to differing city and school district levies layered on top of the state rate.
This calculator runs a standard 30-year fixed mortgage on the financed loan balance and layers Kentucky's property tax estimate and a flat insurance figure on top, producing a PITI total that reflects the real monthly obligation rather than a stripped-down principal-and-interest quote.
How This Is Calculated
- Down payment and loan principal. Down payment cash is the home price times your chosen down payment percentage. Loan principal is home price minus that cash amount.
- Monthly principal and interest (P&I). The loan principal, annual interest rate, and a 360-month (30-year) term feed a standard amortization formula: monthly payment = P × [i(1+i)^n] / [(1+i)^n − 1], where P is the loan principal, i is the monthly interest rate (annual rate ÷ 12), and n is 360 total payments.
- Monthly Kentucky property tax. Home price × 0.71% ÷ 12, reflecting Kentucky's statewide effective average rate, constrained by the state's 4% annual revenue growth cap on most taxing districts.
- Monthly insurance. A flat $125 placeholder for hazard/homeowners insurance, since actual premiums vary by carrier, home age, and claims history.
- Total monthly payment (PITI). Monthly P&I plus monthly property tax plus monthly insurance.
- Full amortization schedule. The engine generates all 360 monthly line items, tracking interest and principal at every payment, so total interest paid reconciles exactly against the sum of every period's interest.
Worked Example
Using the calculator's default inputs: - Home Purchase Price: $380,000 - Down Payment: 20% ($76,000 cash) - Interest Rate: 6.5% APR, 30-year fixed
Step by step: 1. Loan principal = $380,000 − $76,000 = $304,000. 2. Monthly interest rate = 6.5% ÷ 12 = 0.5417% per period. 3. Monthly principal and interest on $304,000 over 360 payments at that rate = $1,921.49 (this is the verified test vector the calculator's engine reconciles against). 4. Monthly Kentucky property tax = $380,000 × 0.71% ÷ 12 = $2,698 ÷ 12 = $224.83. 5. Monthly insurance placeholder = $125.00. 6. Total monthly payment (PITI) = $1,921.49 + $224.83 + $125.00 = $2,271.32. 7. Over the full 360-month term, cumulative interest paid on the $304,000 loan comes to just over $387,733, the difference between total lifetime payments (360 × $1,921.49) and the original principal.
Kentucky's $224.83 monthly property tax component sits close to Indiana's on the same home value and roughly $184 below Iowa's, a meaningful factor when comparing the true carrying cost of homeownership across neighboring states with otherwise similar home prices.
What This Does Not Account For
- Private mortgage insurance (PMI). Down payments under 20% typically trigger PMI, which is not added to the PITI total here.
- County, city, and school district rate variance. Kentucky's 0.71% figure is a statewide effective average; Jefferson, Fayette, and Kenton counties can diverge from it due to differing city and school district levies stacked on the state rate.
- The homestead exemption for seniors and disabled homeowners. Kentucky offers a homestead exemption that reduces assessed value for qualifying owners 65 and older or permanently disabled, adjusted periodically for inflation; this calculator does not model that reduction.
- The 4% revenue growth cap's district-by-district effect. House Bill 44 constrains most taxing districts' year-over-year revenue growth without a public vote, but the practical effect on any single district's rate depends on local assessment growth, which this statewide average does not capture precisely.
- Closing costs and title insurance. Typically 2% to 4% of the loan amount in Kentucky, not reflected here.
- Occupational and local tax overlays unrelated to property tax. Some Kentucky cities levy separate local income or occupational taxes that affect overall cost of living but are outside the scope of a property tax estimate.
Common Pitfalls
- Assuming a low statewide average means every county is cheap. Jefferson and Fayette counties, Kentucky's largest urban centers, often carry combined city, county, and school rates above the 0.71% statewide average due to additional municipal and school levies.
- Forgetting to apply for the homestead exemption if eligible. Kentucky homeowners 65 or older, or permanently disabled, who don't file for the homestead exemption with their county Property Valuation Administrator (PVA) pay more than necessary.
- Comparing this PITI figure to a P&I-only rate quote. Advertised "starting at" mortgage payments from lenders almost always exclude taxes and insurance, understating the true monthly cost of Kentucky homeownership.
- Overlooking that the 4% cap limits revenue growth, not individual rates. A taxing district can still adjust its rate if overall assessed value growth is below the cap threshold, so year-to-year bills are not perfectly static even under the cap.
- Ignoring occupational and city payroll taxes when relocating. These are separate from property tax and not modeled by this calculator, but they materially affect total Kentucky cost of living for salaried buyers.
Frequently Asked Questions
Why is Kentucky's effective property tax rate relatively low?
Does Kentucky offer a homestead exemption?
Are Jefferson County (Louisville) and Fayette County (Lexington) rates higher than the state average?
Does a bigger down payment reduce my Kentucky property tax?
How does Kentucky's 4% revenue growth cap actually work?
Sources
- Kentucky Department of Revenue: Property Tax Rates and county-level effective rate data. revenue.ky.gov
- Consumer Financial Protection Bureau (CFPB): Regulation Z (Truth in Lending Act) disclosure requirements for mortgage APR. ecfr.gov/current/title-12/chapter-X/part-1026
- Federal Reserve Economic Data (FRED): 30-year fixed mortgage rate historical benchmarks. federalreserve.gov
Also consulted: Kentucky Revised Statutes Chapter 132 (property tax administration) and House Bill 44 (1979 revenue growth cap); Kentucky Department of Revenue: Homestead Exemption guidance for seniors and disabled homeowners.