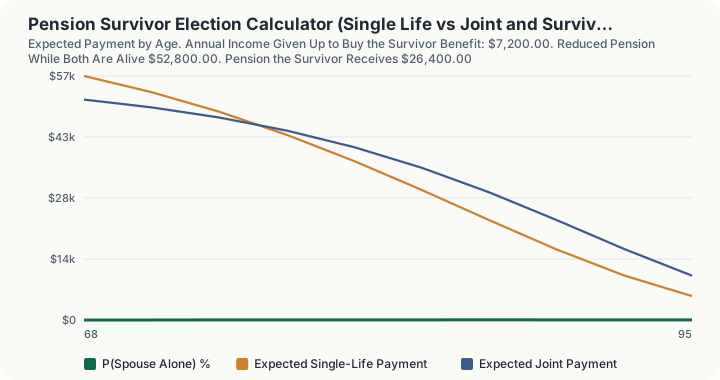
Quick Answer: Electing joint and survivor on a $60,000 single-life pension, at a 12% reduction, costs $7,200.00 a year of permanently surrendered income. It buys a survivor benefit of $26,400 a year, 44.0% of the single-life pension. For a 65-year-old male retiree and a 63-year-old female spouse discounted at 4%, the expected present value of the joint option is $707,736.72 against $694,159.79 for single life, an advantage of $13,576.93, so the survivor stream is worth $1.16 for every dollar surrendered.
What does this calculator do?
A pension election form quotes you a price and nothing else. It says the single-life payment is $60,000 and the joint-and-survivor payment is $52,800, and it leaves you to decide.
The two things that actually decide whether that is a good purchase are not on the form:
- How likely the spouse is to be the survivor, which depends on both ages and both mortality bases.
- How much of the survivor's spending this pension is actually carrying, which depends on what other income the survivor keeps.
There is also a trap in the arithmetic itself. A "50% survivor benefit" is 50% of the already reduced payment, not 50% of the single-life figure. On the defaults that is $26,400, which is 44.0% of the $60,000 the household was expecting. Household spending does not fall 56% when one person dies. Housing, property tax, insurance and utilities barely move at all.
This calculator values both election paths as expected present values, using mortality fitted to the SSA period life table, and reports the shortfall the survivor is left with.
How is this calculated?
The joint-and-survivor reduction factor is set by your plan's own actuary. No statute publishes it, and no authority publishes a standard table of them, so it is a user input taken from your election paperwork. Everything else is computed.
PV_single = ∑(t = 1 to T) (P_single × P(retiree alive at t))/((1 + r)ᵗ)
PV_joint = ∑(t = 1 to T) (P_joint × P(retiree alive) + P_surv × [1 − P(retiree alive)] × P(spouse alive))/((1 + r)ᵗ)
Step by step:
Step 1: Apply the reduction to get the joint payment. Single-life annual payment times (1 minus the reduction percentage).
Step 2: Apply the continuation percentage to get the survivor payment. The continuation applies to the reduced payment, not the original.
Step 3: Find the annual cost of the election. Single-life payment minus joint payment. This is the headline figure.
Step 4: Build survival probabilities for each future year. Mortality comes from a Gompertz-style log-linear fit to the SSA annual mortality-rate anchors, run out to age 110. The two lives are treated as independent.
Step 5: Discount and sum the single-life stream. Each year's payment weighted by the probability the retiree is alive, discounted at the entered rate.
Step 6: Discount and sum the joint stream. The reduced payment while the retiree lives, plus the survivor payment weighted by the probability the retiree is dead and the spouse alive.
Step 7: Difference the two present values. Both are rounded to cents first, then differenced, so the displayed advantage always equals the displayed difference.
Step 8: Compute value per dollar surrendered. The expected present value of the survivor leg alone, divided by the expected present value of the income given up. Below 1.00 the plan is charging more than the benefit is worth in expectation.
Step 9: Measure the survivor's shortfall. Spending need, less other income, less the survivor pension, floored at zero.
Step 10: Price a lump sum that would close it. The gap multiplied by an ordinary annuity factor at the discount rate, run for the spouse's remaining life expectancy measured at the age they would reach when the retiree reaches theirs.
On the probability output, precisely. The figure labelled "Probability the Spouse Is Alive and the Retiree Is Not, at the Retiree's Life Expectancy" is a point-in-time state probability at one horizon. It is the chance that, at the single moment the retiree reaches their own life expectancy, the spouse is alive and the retiree is not. It is not the lifetime probability that the spouse outlives the retiree, which would be an integral over every possible ordering of the two deaths. The engine does not compute that, and this page does not claim it does.
Worked Example
Using the defaults: $60,000 single-life pension, 12% reduction, 50% continuation, retiree 65 (male basis), spouse 63 (female basis), 4% discount rate, survivor spending need $55,000, survivor other income $24,000.
Step 1: Compute the reduced joint payment. $60,000 × (1 − 0.12) = $52,800.00 per year
Step 2: Compute the survivor payment. $52,800 × 50% = $26,400.00 per year
Step 3: Compute the annual cost of the election. $60,000 − $52,800 = $7,200.00 per year, for life
Step 4: Express the survivor payment against the original pension. $26,400 ÷ $60,000 = 44.0%, not the 50% the form implies.
Step 5: Read the two life expectancies. Retiree at 65: 18.12 years. Spouse at 63: 22.27 years.
Step 6: Present-value the single-life stream. Summing the mortality-weighted, discounted payments gives $694,159.79.
Step 7: Present-value the joint stream. The same summation over both legs gives $707,736.72.
Step 8: Difference them. $707,736.72 − $694,159.79 = $13,576.93 in favour of the joint election
Step 9: Read the value per dollar surrendered. The survivor leg's expected present value divided by the surrendered income's expected present value is 1.16. Every dollar given up buys $1.16 of expected survivor income.
Step 10: Read the expected duration. The survivor benefit is expected to be paid for 7.7 years, and the point-in-time probability that the spouse is alive and the retiree is not, measured at the retiree's 18.12-year life expectancy, is 33.46%.
Step 11: Find the survivor's annual shortfall. $55,000 − $24,000 − $26,400 = $4,600.00 a year
Step 12: Price the lump sum that would close it. The spouse's remaining life expectancy at age 81 is 9.26 years, rounded to 9 years. The 4% ordinary annuity factor for 9 years is 7.4353. $4,600 × 7.4353 = $34,202.53
Even after electing the joint option, the survivor is $4,600 a year short, and roughly $34,200 of life insurance would close that gap.
Carrying the Election Forward Through the Ages
Step 13: Age 68, three years in. Expected single-life payment $56,922.57, expected joint payment $51,409.31. The probability the spouse is alive and the retiree is not: 4.99%.
Step 14: Age 71. Single-life $53,144.42, joint $49,595.83. The gap has narrowed from $5,513.26 to $3,548.59, purely because the survivor leg is starting to carry weight.
Step 15: Age 77, where the election turns positive. Single-life $43,214.93, joint $44,195.61. This is the first age at which the expected joint payment exceeds the expected single-life payment, by $980.68.
Step 16: Age 95. Single-life $5,586.02, joint $10,324.53: nearly double, on a spouse-alone probability of 20.49%.
The 12% haircut is paid in full from day one and only earns it back after roughly twelve years. That is the whole shape of the decision: the election is expensive early, and it is insurance rather than an investment, so the case for it rests on what the survivor's position looks like at 85 and not on what the household's income looks like at 66.
What does this calculator not account for?
- Correlated mortality. The two lives are treated as statistically independent. Real spouses share environment, habits and health shocks, and joint mortality is positively correlated, which biases the expected survivor years slightly upward.
- The lifetime probability that the spouse outlives the retiree. The probability output is a snapshot at one horizon, as described above. The engine computes nothing else.
- Plan-specific pop-up provisions. Many plans restore the full single-life payment if the spouse dies first. That is a valuable option and it is not modelled.
- Cost-of-living adjustments. Both streams are treated as level nominal payments.
- Income tax. Both options are taxed as ordinary income; the calculator compares pre-tax streams.
- Plan solvency and PBGC guarantee limits.
- Insurance underwriting. The lump sum in step 12 is what the gap costs in present-value terms, not a quoted premium, and it assumes the retiree is insurable.
- Sub-annual timing. Payments are treated as annual, at year end.
What mistakes do people make with this?
- Reading "50% survivor" as half the pension you were quoted. It is half of the reduced payment. On these defaults it is 44.0% of the single-life figure.
- Assuming the survivor needs half the income. Fixed household costs barely move when one person dies. The default here assumes $55,000 of the previous spending survives.
- Comparing the two payments and stopping. The comparison that matters is between two probability-weighted streams of different lengths, not between two dollar figures.
- "Pension maximization" sold without arithmetic. Taking single life and buying life insurance can beat the joint election, but only if the premium is genuinely below the annual cost of the election and the policy is guaranteed for life. Compare the $7,200 against a real quote, not a projection.
- Forgetting the election is usually irrevocable once payments start, and that federal law requires spousal consent to waive it.
- Using the same mortality basis for both lives. Sex-based mortality differs materially, and it is what decides who is likely to be the survivor.
Frequently Asked Questions
Is the joint-and-survivor option worth it on these defaults?
Where do I find the reduction percentage?
Why does the survivor still have a shortfall after electing the joint option?
Does the probability figure mean the spouse is 33% likely to outlive the retiree?
What if my spouse is older than me?
Can I take single life and buy life insurance instead?
Sources
- Social Security Administration, Office of the Chief Actuary, Period Life Table, ssa.gov/oact/STATS/table4c6.html: the mortality-rate and life-expectancy anchors held in
engine/tables/2026/ssa-life.json. SSA's period life table lags the current year while mortality data is finalized; the table served at this URL is dated to 2023 mortality experience and is the one referenced by the 2026 Trustees Report. The "unisex" column is not published by SSA and is computed as the simple average of the male and female figures.
Also consulted: Joint-and-survivor reduction factors: your plan's own election paperwork. These are set by each plan's actuary. No statutory or regulatory table publishes them, and the calculator does not invent one; Retirement Equity Act of 1984: the requirement that a married participant's spouse consent in writing to waiving a qualified joint and survivor annuity.