Quick Answer: Comparing a pension to a lump sum buyout on pure present-value terms means discounting every future monthly payment by both how long you're expected to live and how much a dollar today is worth compared to a dollar received years from now, and whichever total comes out higher is the better deal in strictly financial terms.
Overview
Companies that still offer traditional pensions occasionally offer departing or retiring employees a choice: keep the lifetime monthly pension payment, or take a single lump sum today instead. On the surface this looks like a simple comparison, add up the monthly payments and see which is bigger, but that approach ignores two things that matter enormously: money today is worth more than the same money years from now, and a pension only keeps paying for as long as you're alive to collect it.
This calculator handles both factors properly. It discounts every future pension payment back to today's dollars using your own assumed rate of return, the return you could reasonably expect if you invested the lump sum yourself instead. And it weights each future payment by the actual probability you'll be alive to receive it, using Social Security Administration mortality data, rather than naively assuming you'll live to some fixed age and collect every single payment with certainty.
To be direct about what this calculator does and doesn't decide for you: it answers a narrow, purely financial question, which option is worth more in present-value dollars, given your assumptions. It does not weigh in on longevity risk (the very real possibility you live much longer than statistically expected and a pension protects you from outliving your money in a way a lump sum doesn't), employer credit risk (a company that terminates its pension plan may have that pension shifted to the Pension Benefit Guaranty Corporation, with potentially reduced payments), or simple peace of mind. Those are legitimate, often decisive factors for real people making this decision, and they belong in the "what this does not account for" conversation below, not baked silently into a number.
How This Is Calculated
The engine here builds directly on the platform's actuarial primitives, specifically the same method used by presentValueOfLifeAnnuity, extended to optionally support an annual cost-of-living adjustment (COLA) on the pension payment, which the base primitive doesn't handle.
For each future year, starting one year from now and continuing out to age 100:
- Find the probability you're alive that year. The platform's actuarial primitive fits a Gompertz-style log-linear curve to Social Security Administration period life table mortality rates, then chains one year's survival onto the next to get the odds you are still alive to collect that year's payment. Adult mortality rates rise roughly geometrically with age, which is why a log-linear fit is the standard way to interpolate between the table's five-year anchor ages.
- Calculate that year's payment. The annual pension amount (12 times your monthly payment) is grown by your COLA percentage, compounding each year if you specified one, or held flat if you didn't.
- Weight the payment by the survival probability. A payment you have a 95% chance of collecting is worth 95% of its face value in expectation; a payment you have a 40% chance of collecting is worth 40% of its face value.
- Discount that expected payment back to today. The survival-weighted payment is divided by (1 + your discount rate) raised to the power of how many years in the future it falls.
- Sum every year's discounted, survival-weighted value. That total is the pension's present value.
The lump sum offer, by contrast, needs no discounting or survival weighting at all. It's already a today's-dollars, guaranteed-if-you-accept-it number, which is exactly why it's called a lump sum. The comparison is simply the pension's calculated present value against the lump sum as stated.
When the cost-of-living adjustment is set to 0%, this method produces the mathematically identical result to calling the platform's presentValueOfLifeAnnuity primitive directly, since both are computing the exact same survival-weighted, discounted sum.
Worked Example
Take a 62-year-old with a $2,500 monthly pension offer, a $350,000 lump sum alternative, a 5% assumed discount rate, unisex life expectancy assumptions, and no cost-of-living adjustment.
The Social Security Administration's period life table puts remaining life expectancy at age 62 at 21.69 years (unisex). That's the anchor for the survival probability curve: the model is built so that the probability of surviving roughly that many additional years comes out close to 50%, with probabilities tapering off gradually in both directions around that point, the way actual mortality data behaves rather than a hard cutoff.
The annual pension payment is $2,500 times 12, or $30,000 a year, held flat since there's no COLA in this example. Each future year's $30,000 payment gets multiplied by that year's survival probability, then discounted back to today at 5% annually. Early years, where survival probability is still high and the discount period is short, contribute the most to the total. Later years, where survival probability has dropped and the discount period has grown, contribute progressively less, even though the nominal payment amount hasn't changed.
Summing all of that across every year out to age 100 produces the pension's total present value. Comparing that figure against the flat $350,000 lump sum tells you, in pure present-value terms, which option is worth more. Raise the discount rate and the pension's present value falls, since future payments get discounted more heavily, making the lump sum comparatively more attractive. Add a cost-of-living adjustment and the pension's present value rises, since later payments are worth more in nominal terms, partially offsetting the discounting effect.
Carrying the Stream Forward Year by Year
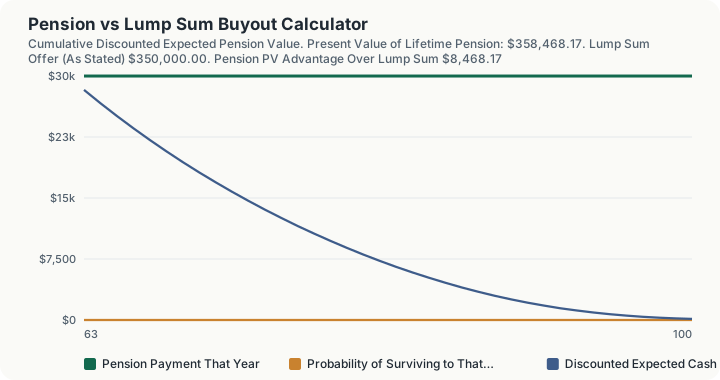
Step 1 -- Age 63, the first year. $30,000 payment, survival probability 0.9902, discounted expected cash flow $28,290.37. Cumulative present value: $28,290.37.
Step 2 -- Age 64. $30,000 payment, survival probability 0.9795, discounted expected cash flow $26,652.75. Cumulative present value: $54,943.12.
Step 3 -- Age 72, ten years in. Survival probability has fallen to 0.8564 and the year's contribution to $15,771.97, roughly 56% of what the first year contributed. Cumulative present value: $216,804.81.
Step 4 -- Age 90, where the pension overtakes the offer. Cumulative present value reaches $350,909.31, the first year it clears the $350,000 lump sum.
Step 5 -- The full run to age 100. $358,468.17, an advantage of $8,468.17 over the lump sum.
Sixty percent of the pension's present value is banked within the first ten years, and the whole stretch from age 90 to age 100 adds only $7,558.86. Read that as the answer to the real question: the pension wins here not because the retiree lives to 100 but because the offer is a shade too thin to cover the first twenty-five years, and every year after age 90 is a rounding difference on top.
What This Does Not Account For
- Longevity risk. A pension is, functionally, insurance against outliving your money. If you live well past your statistical life expectancy, the pension keeps paying regardless, while a lump sum's ultimate value depends entirely on whether you (or your investment strategy) manage to make it last.
- Employer or plan sponsor credit risk. A company in financial distress may terminate its pension plan, shifting obligations to the Pension Benefit Guaranty Corporation, a federal insurer that caps its guaranteed payments below what some higher earners were originally promised.
- Investment risk on the lump sum. This calculator assumes you'd earn your stated discount rate consistently if you took the lump sum and invested it yourself. Real investment returns vary year to year, and poor returns in the years right after receiving a lump sum (sequence-of-returns risk) can meaningfully erode its real-world value even if the long-run average return matches your assumption.
- Spousal and survivor benefit options. Many pensions offer a choice between a higher single-life payment and a lower joint-and-survivor payment that continues for a surviving spouse. This calculator models a single life stream; a joint option would require different survival-probability assumptions covering two lives.
- Taxes. Both pension payments and a lump sum rollover into a tax-advantaged account are generally taxed as ordinary income upon withdrawal; a lump sum taken as cash outside a rollover triggers immediate taxation (and possibly an early-withdrawal penalty) that isn't modeled here.
- Health and family longevity history. The SSA's population-level mortality data doesn't know anything about your personal health status or family history, both of which meaningfully affect an individual's actual expected lifespan.
Common Pitfalls
- Choosing an unrealistically high discount rate to justify taking the lump sum. It's tempting to assume you'll consistently earn double-digit returns to make the lump sum look better on paper, but the discount rate should reflect a realistic, sustainable long-run return for how you'd actually invest the money, not an optimistic best case.
- Ignoring survival probability entirely and just multiplying monthly payment by expected years remaining. That shortcut overstates the pension's value in early years (when you're very likely to be collecting) and understates the tail-end uncertainty that survival-weighting properly captures.
- Treating "present value is higher" as the complete answer. A pension with a slightly lower present value might still be the right choice for someone who deeply values guaranteed income and can't tolerate the risk of a lump sum running out, and the reverse is true for someone confident in their own investment discipline who wants control over the assets.
- Forgetting a COLA-adjusted pension needs a materially different comparison than a flat one. A pension with even a modest 2% annual COLA is worth meaningfully more over a multi-decade retirement than an otherwise identical flat pension, a difference this calculator explicitly lets you model.
- Comparing pre-tax lump sum figures to after-tax spending plans. Make sure you're comparing like with like; a lump sum rolled into an IRA is not the same as a lump sum received as taxable cash in hand.
Frequently Asked Questions
What discount rate should I use?
Why does the calculator use survival probability instead of just my life expectancy?
Is the lump sum always better if I could invest it at a higher rate than the pension assumes?
What if my pension includes a cost-of-living adjustment?
Should I get professional advice before making this decision?
Sources
- Social Security Administration Office of the Chief Actuary, Period Life Table (2026 Trustees Report basis), sourced from ssa.gov/oact/STATS/table4c6.html. ssa.gov
- Internal Revenue Service, Publication 575, "Pension and Annuity Income," for general federal tax treatment of pension and lump sum distributions. irs.gov/publications/p575
Also consulted: Pension Benefit Guaranty Corporation, "Maximum Monthly Guarantee Tables," for general background on pension insurance limits (not directly modeled in this calculator).