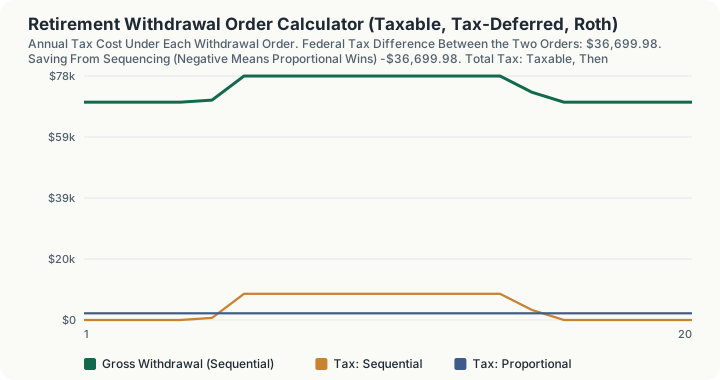
Quick Answer: $300,000 taxable, $500,000 traditional and $200,000 Roth, spending $70,000 a year for twenty years, produces a $36,699.98 federal tax gap between the two withdrawal orders, and drawing proportionally wins. The conventional taxable-first order costs $79,678.78 over the twenty years; the proportional draw costs $42,978.80. The proportional strategy also ends with $148,340.55 left against $86,508.51.
What does this calculator do?
The advice everyone repeats is: spend the taxable brokerage account first, then the traditional IRA, then the Roth last. The reasoning is that it maximises the number of years that tax-sheltered money keeps compounding.
That reasoning is real but it is only half the picture, and the half it leaves out is often larger.
Draining the taxable account first means the early years produce almost no ordinary income. The low ordinary brackets sit empty, and the 0% long-term capital gains band sits empty, so realised gains fall into that empty space and are taxed at nothing. That is the case for sequencing, and on these defaults it produces a $0.00 tax bill in year one.
But the money does not disappear. It means the entire traditional balance has to come out in a compressed block of later years, at marginal rates a proportional draw would never have reached. On these defaults that second effect dominates, and the conventional order costs nearly twice as much federal tax over the horizon.
Which effect wins depends on the balance mix, the spending level, and how much other ordinary income is already filling the low brackets. This calculator runs both orders on identical facts and names the winner rather than assuming it.
How is this calculated?
Realised gain = taxable draw × (1 − cost basis fraction)
Ordinary income = other income + tax-deferred draw
T_LTCG = LTCG(ordinary taxable + gain) − LTCG(ordinary taxable)
gross_(n + 1) = spending + T(grossₙ)
The tax model, exactly as implemented:
- A taxable-account withdrawal produces a long-term capital gain equal to the withdrawal times one minus the cost basis fraction. Only the gain is taxed.
- A tax-deferred withdrawal is ordinary income in full.
- A Roth withdrawal is not taxed at all, assumed qualified.
- Long-term gains are stacked above ordinary taxable income, so the rate on the gain depends on how much ordinary income sits underneath it. That stacking is the entire mechanism by which the order matters.
Step by step, per year:
Step 1: Solve the circularity. A retiree needs a fixed amount of spending money, not a fixed gross withdrawal, and the gross must cover both the spending and the tax the gross itself triggers. The engine resolves this by fixed-point iteration: gross = spending + tax(gross), run 40 times. The iteration contracts because the marginal rate is below 100%, and 40 passes is far past the point where the result stops moving at cent precision.
Step 2: Allocate the gross across the buckets. Under sequential, take from taxable until it is empty, then tax-deferred, then Roth. Under proportional, split the gross across all three in proportion to current balances, with the Roth slice absorbing the rounding remainder so the parts sum exactly.
Step 3: Compute the ordinary tax. Other income plus the tax-deferred draw, less the standard deduction, on the 2026 ordinary schedule.
Step 4: Compute the capital gains tax. Stack the realised gain above the ordinary taxable income and take the difference in the long-term schedule evaluated at the two points.
Step 5: Grow the remaining balances at the entered rate, bucket by bucket.
Step 6: Repeat for the horizon, then total the tax, the gross withdrawn, and the ending balance for each strategy.
Step 7: Difference the two totals. A negative saving-from-sequencing figure means the proportional draw won.
Worked Example
Using the defaults: $300,000 / $500,000 / $200,000, 60% basis, $70,000 spending, 5% growth, 20 years, single, no other income. The 2026 single standard deduction is $16,100 and the 0% long-term capital gains band runs to $49,450.
Step 1: Year 1 under the sequential order: draw entirely from taxable. The gross settles at $70,000, all from the brokerage account.
Step 2: Find the realised gain. $70,000 × (1 − 0.60) = $28,000.00
Step 3: Find the ordinary taxable income. There is no other income and no tax-deferred draw, so ordinary taxable income is $0.00.
Step 4: Stack the gain and tax it. $0 + $28,000 = $28,000, which sits entirely inside the $49,450 zero-rate band. Year 1 sequential tax = $0.00
Step 5: Year 1 under the proportional order: split by balance. The buckets are 30% / 50% / 20% of the $1,000,000 total, so the gross of $72,148.94 splits into $21,644.68 taxable, $36,074.47 tax-deferred, and $14,429.79 Roth.
Step 6: Compute the ordinary tax on the proportional draw. $36,074.47 − $16,100 = $19,974.47 of ordinary taxable income. 10% × $12,400 = $1,240.00; 12% × $7,574.47 = $908.94. $1,240.00 + $908.94 = $2,148.94
Step 7: Compute the capital gains tax on the proportional draw. Realised gain is $21,644.68 × 0.40 = $8,657.87. Stacked on $19,974.47 of ordinary taxable income, the top of the gain sits at $28,632.34, still inside the 0% band. Capital gains tax = $0.00, so year 1 proportional tax = $2,148.94
Step 8: Note who is ahead after one year. Sequencing wins year 1 by $2,148.94. This is the part of the story that gets repeated.
Step 9: Total the twenty years under each order. Sequential total federal tax: $79,678.78. Proportional total federal tax: $42,978.80.
Step 10: Difference them. $79,678.78 − $42,978.80 = $36,699.98 in favour of the proportional draw
Step 11: Compare tax as a share of withdrawals. Sequential: $79,678.78 ÷ $1,479,678.78 = 5.38%. Proportional: $42,978.80 ÷ $1,442,978.80 = 2.98%.
Step 12: Compare what is left at the end. Sequential ends with $86,508.51. Proportional ends with $148,340.55, a difference of $61,832.04.
Both strategies funded the same $1,400,000 of spending over the twenty years, and neither depleted the portfolio. The proportional draw simply cost less tax getting there, because it used the low brackets and the standard deduction every single year instead of leaving them empty early and overflowing them late.
Carrying Both Orders Into Later Years
Step 13: Year two. Sequential tax $0.00 again; proportional tax $2,148.94 again. Cumulative after two years: sequential $0.00, proportional $4,297.88. Sequencing looks like it is winning comfortably.
Step 14: Year five, where the taxable account runs dry. The sequential gross rises to $70,671.37 and sequential tax appears for the first time: $671.37. Cumulative sequential $671.37 against proportional $10,744.70.
Step 15: Year six, the first full year on tax-deferred money. Sequential gross $78,423.08, sequential tax $8,423.08 in one year, nearly four times the proportional figure. Cumulative sequential $9,094.45 against proportional $12,893.64.
Step 16: Year seven, where the cumulative totals cross. Cumulative sequential $17,517.53 overtakes cumulative proportional $15,042.58, and never trails again through year twenty.
The sequential order buys four tax-free years and pays for them from year six onward. Anyone who measures this decision over a five-year window will reach the opposite conclusion from anyone who measures it over twenty, and the schedule shows exactly where the sign flips: year seven.
What does this calculator not account for?
- State income tax, which can reverse the conclusion in a state that taxes capital gains as ordinary income.
- The taxation of Social Security under section 86. No Social Security is modelled, and its provisional-income phase-in would penalise the tax-deferred draws in the proportional strategy.
- Medicare IRMAA surcharges, which key off MAGI and would penalise the compressed later years of the sequential strategy.
- The 3.8% net investment income tax.
- Required minimum distributions. This is a significant omission and it cuts against the sequential order: RMDs force tax-deferred withdrawals whether or not the plan wanted them, which is precisely the problem a taxable-first strategy builds up.
- Roth conversions in low-income years, which are usually the right answer to the problem this calculator exposes.
- Basis step-up at death, which is the strongest argument for preserving the taxable account rather than spending it first.
- A changing cost basis fraction. The basis share of the taxable account is held constant as it is drawn down; in reality it drifts.
- Inflation. Spending is held at a constant nominal figure.
- Sequence-of-returns risk. Growth is a flat annual rate, not a return path.
What mistakes do people make with this?
- Treating "taxable first" as a rule. It is a hypothesis, and on these defaults it is wrong by $36,699.98.
- Judging by year one. Sequencing looks brilliant in year one here: $0 of tax against $2,148.94. Judging on that is exactly how the strategy costs $36,700 over twenty years.
- Forgetting the standard deduction is use-it-or-lose-it. Every year with no ordinary income wastes $16,100 of deduction that could have absorbed traditional-IRA dollars tax free.
- Forgetting the 0% capital gains band is also use-it-or-lose-it.
- Ignoring what RMDs will do to the plan. A strategy that leaves the traditional balance untouched and growing is a strategy that hands you a much larger forced distribution later.
- Assuming the Roth should always go last. Its value is that it can be drawn in a high-income year without adding a dollar of income. Saving all of it for the very end wastes that flexibility.
- Reading the ending balances as equivalent. A dollar in a traditional IRA is not a dollar in a Roth. The calculator compares nominal balances, not after-tax value.
Frequently Asked Questions
Should I really spend my taxable account first?
Why does drawing proportionally beat the conventional order here?
When does the conventional order actually win?
Does the cost basis of the taxable account matter?
Are required minimum distributions included?
Would Roth conversions help?
Sources
- IRS Revenue Procedure 2025-32 (Internal Revenue Bulletin 2025-45), irs.gov/pub/irs-drop/rp-25-32.pdf: the 2026 ordinary brackets, the $16,100 single and $32,200 joint standard deductions, and the 0%/15%/20% long-term capital gains thresholds. Held in
engine/tables/2026/federal-tax.json, verified 2026-08-21. - IRC section 1(h): the stacking rule that places net long-term capital gain above ordinary income in the rate schedule, which is the mechanism this calculator turns on. law.cornell.edu/uscode/text/26/1
- IRC section 408A(d): the qualified distribution rules under which Roth withdrawals are treated as untaxed here. law.cornell.edu/uscode/text/26/408A