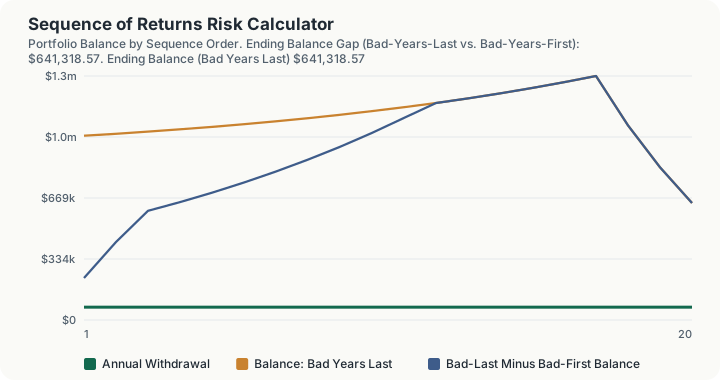
Quick Answer: On a $1,000,000 portfolio taking $70,000 a year in fixed withdrawals over 20 years, the exact same three -15% years and seventeen +8% years (a 4.55% average annual return either way) fully depletes the portfolio by year 12 if the bad years hit first, but leaves $641,318.57 remaining if the identical bad years hit last instead. Same average return, same withdrawals, same number of good and bad years, a $641,318.57 difference in outcome purely from timing.
Overview
Sequence of returns risk is the danger that the order in which investment returns occur, not just their average, determines whether a retirement portfolio survives a fixed withdrawal schedule. During the accumulation years before retirement, order genuinely does not matter much: a portfolio that earns -15% and then +8% ends up worth the same as one that earns +8% and then -15%, because nothing is being withdrawn along the way to interact with the timing. Once fixed withdrawals begin, that symmetry breaks completely. A loss that occurs early, while the balance is still large and withdrawals are actively coming out of it, permanently shrinks the base that all future growth compounds on. The identical loss occurring late, after years of growth have built the balance up and the same total dollar withdrawals have already been comfortably funded along the way, does far less damage.
This is not a subtle or marginal effect. It is one of the best-documented and most counterintuitive findings in retirement withdrawal research, closely related to the safe-withdrawal-rate literature that grew out of the Trinity Study: two portfolios with mathematically identical average annual returns over the identical time horizon, taking the identical withdrawals, can produce wildly different outcomes, up to and including one portfolio surviving comfortably while the other is completely exhausted, based entirely on which years the bad returns happened to fall in.
This calculator builds two return sequences from the exact same underlying set of annual returns (a chosen number of "bad" years and "good" years), simply reordered: one sequence puts all the bad years first, the other puts all the bad years last. Because both sequences contain the identical multiset of annual returns, their arithmetic average is mathematically guaranteed to be identical. Any difference in the resulting portfolio trajectory is therefore attributable purely to sequencing, not to any difference in assumed investment performance.
How This Is Calculated
Step 1: Construct two sequences from the same returns, reordered. Given a number of bad years, a bad-year return, a number of good years (the remainder of the horizon), and a good-year return, this calculator builds:
- Bad-Years-First: all bad-year returns, then all good-year returns.
- Bad-Years-Last: all good-year returns, then all bad-year returns.
Step 2: Verify the average is identical by construction.
This single average applies equally to both sequences, since both contain the exact same set of annual returns.
Step 3: Project the year-by-year balance for each sequence independently, applying that year's return first and then subtracting the fixed annual withdrawal:
If a sequence's balance ever reaches zero, it stays at zero for the remainder of the horizon (the portfolio is depleted; it cannot recover from a $0 balance under continued fixed withdrawals) and the year of depletion is recorded.
Step 4: Compare the two sequences' ending balances (or depletion years) side by side. The gap between them is entirely a function of ordering, since every other input, starting balance, withdrawal amount, number of years, set of returns, is held exactly identical between the two.
Worked Example
A $1,000,000 portfolio, $70,000 fixed annual withdrawal (not adjusted for inflation), over a 20-year horizon, with 3 bad years at -15% and 17 good years at +8%.
Bad-years-first sequence: -15% in years 1-3, then +8% for years 4-20. - Year 1: $1,000,000 × 0.85 − $70,000 = $780,000 - Year 2: $780,000 × 0.85 − $70,000 = $593,000 - Year 3: $593,000 × 0.85 − $70,000 = $434,050 - By year 11, after eight years of +8% growth on a badly diminished base, the balance is down to $58,832.31. - Year 12: the portfolio is fully depleted. The withdrawal that year exceeds what remains after that year's growth, and the balance hits $0, where it stays for the remaining eight years of the 20-year horizon.
Bad-years-last sequence, identical inputs, reversed order: +8% for years 1-17, then -15% in years 18-20. - Year 1: $1,000,000 × 1.08 − $70,000 = $1,010,000 - Seventeen consecutive +8% years build the balance to $1,337,502.26 by year 17, comfortably funding every $70,000 withdrawal along the way with room to spare. - The three -15% years then arrive in years 18-20, each one a real loss, dropping the balance from $1,337,502.26 to $1,066,876.92, then $836,845.38, then $641,318.57 by year 20.
The average annual return for both sequences is identical: 4.55%. Both portfolios experienced the exact same three -15% years and the exact same seventeen +8% years. The bad-years-first portfolio is completely exhausted eight years before the end of the horizon. The bad-years-last portfolio ends with $641,318.57, nearly two-thirds of the original starting balance. This is sequence of returns risk in its purest, most isolated form.
What This Does Not Account For
- Inflation-adjusted withdrawals. This calculator uses a flat, non-increasing annual withdrawal amount specifically to isolate the sequence effect; most real retirement plans increase withdrawals over time to preserve purchasing power, which generally makes portfolio survival somewhat more sensitive to early losses, not less.
- Realistic, non-simplified return patterns. Real markets do not deliver a clean block of consecutive bad years followed by a clean block of consecutive good years (or vice versa); actual historical sequences are far more irregular. This calculator uses a stylized two-block pattern specifically because it makes the underlying mechanism unambiguous and easy to verify by hand.
- Any mitigation strategy. Approaches like a dynamic (rather than fixed) withdrawal rate, a cash buffer to avoid selling depressed assets, or a "guardrails" spending policy can meaningfully reduce sequence risk in practice; none of that flexibility is modeled here, deliberately, so the raw effect is visible without any offsetting adjustment.
- Taxes on withdrawals or investment growth, which are not modeled and would reduce the effective amount available in both sequences, though not in a way that changes the fundamental sequencing conclusion.
- Multiple asset classes or rebalancing. This is a single-blended-portfolio model with one return figure per year, not a multi-asset simulation with periodic rebalancing between stocks, bonds, and cash.
Common Pitfalls
- Judging retirement readiness by average expected return alone. As this calculator demonstrates directly, two portfolios with an identical average return can produce completely different survival outcomes; average return is necessary information but is not sufficient to assess withdrawal safety.
- Assuming the danger only applies to catastrophic market crashes. Sequence risk is a general mathematical property of withdrawing from a variable-return portfolio; it applies at any combination of return volatility and withdrawal rate, though the effect becomes more dramatic as either grows.
- Believing a portfolio that has survived several early good years is now "safe." The reverse risk exists too: a portfolio that has enjoyed strong early returns and correspondingly increased its withdrawal rate can still be vulnerable to a later downturn, particularly if it grew complacent about spending based on early success.
- Treating the retirement start date as something that can be perfectly timed to avoid this risk. Since nobody can predict market returns years in advance, sequence risk cannot be planned away by picking a "good" retirement date; it can only be managed through withdrawal flexibility, diversification, and maintaining a buffer against needing to sell into a downturn.
- Confusing sequence of returns risk with simple market risk. Market risk is the danger that returns are lower than expected. Sequence risk is a distinct, additional danger that exists even when the long-run average return turns out exactly as expected, purely because of when the variance around that average occurred.
Frequently Asked Questions
Does sequence of returns risk matter during the accumulation (working) years?
Is there a way to eliminate sequence of returns risk entirely?
Why does this calculator use a fixed dollar withdrawal instead of a percentage of the current balance?
How does this relate to the Trinity Study and the "4% rule"?
If both sequences have the same average return, why does the order matter so much mathematically?
Sources
- Milevsky, M. A. and Robinson, C. (2005), "A Sustainable Spending Rate without Simulation," Financial Analysts Journal 61(6). doi.org/10.2469/faj.v61.n6.2776
- Milevsky, M. A. and Huang, H. (2011), "Spending Retirement on Planet Vulcan: The Impact of Longevity Risk Aversion on Optimal Withdrawal Rates," Financial Analysts Journal 67(2). doi.org/10.2469/faj.v67.n2.2
Also consulted: Cooley, Hubbard, and Walz, "Retirement Savings: Choosing a Withdrawal Rate That Is Sustainable" (the Trinity Study), AAII Journal, 1998, and subsequent updates; Kitces, Michael, "Understanding Sequence of Return Risk: Safe Withdrawal Rates, Bear Market Crashes, and Bad Decades," Nerd's Eye View, kitces.com; Pfau, Wade, "How Much Can I Spend in Retirement? A Guide to Safe Withdrawal Rates," retirement income and safe-withdrawal-rate research; Bengen, William P., "Determining Withdrawal Rates Using Historical Data," Journal of Financial Planning, 1994, the original safe-withdrawal-rate study establishing the sequence-sensitivity of retirement portfolios.