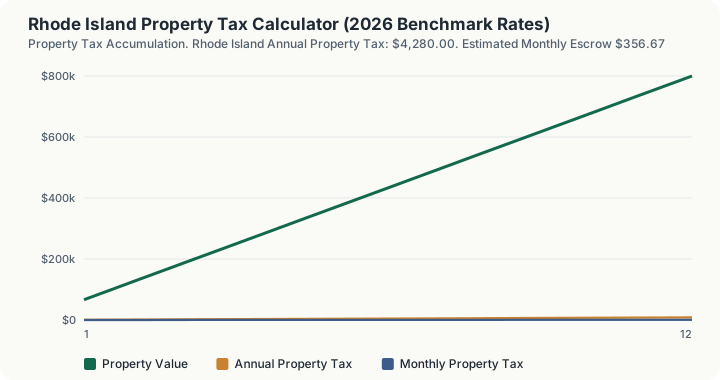
Quick Answer: A $400,000 home in Rhode Island carries an estimated $4,280.00 in annual property tax at the state's 1.07% effective rate, or about $356.67 a month.
Rhode Island's 1.07% in Context
The average effective property tax rate across Rhode Island is 1.07%, above the national median and good for #15 nationally. Measured against the roughly 1.0% average effective rate nationwide, Rhode Island's number comes in modestly above the national average of roughly 1.0%. Within the Northeast, where the average effective rate runs near 1.61%, Rhode Island sits well below the regional norm.
Like its neighbors elsewhere in the Northeast, Rhode Island relies on property tax as the primary funding mechanism for public schools, emergency services, and county infrastructure, with local taxing authorities setting the actual millage each year.
None of that municipal variation is selectable here. This page takes two numbers, an assessed value and a flat dollar exemption, and returns a single figure: $4,280.00 a year on a $400,000 home, $356.67 a month. A Providence parcel and a Little Compton parcel of the same value return the identical answer.
How This Is Calculated
Rhode Island caps municipal levy growth at 4% a year by statute, and requires a statistical revaluation every three years with a full physical revaluation every nine. Because the ceiling sits on the town's total collection rather than on your parcel, a revaluation shifts the burden between owners without letting the town collect much more.
None of that detail is asked for here. This calculator works one level up, applying Rhode Island's average effective property tax rate of 1.07% to the value you enter. That rate is the ratio of property taxes actually paid to home value across the state, so the assessment ratios, caps, and exemptions described above are already baked into it.
Working through it in order:
- Subtract the exemption from the value you entered. The engine computes
max(0, value - exemption). On the built-in $25,000 exemption scenario a $400,000 Rhode Island home becomes $375,000.00 of taxable value. - Multiply that taxable figure by 1.07%. $375,000.00 at 1.07% is $4,012.50 a year, against $4,280.00 with the exemption field left at its $0 default.
- Divide by twelve for escrow. $4,012.50 / 12 = $334.38 a month, or $356.67 on the unexempted figure.
There is no fourth step. This calculator performs no assessment-ratio conversion, no local millage lookup, no county or school-district selection and no reassessment modelling. 1.07% is a single statewide average effective rate applied flat from the first taxable dollar, and everything the Rhode Island statutes do with ratios, classifications, caps and relief programs is already folded into that one published number rather than computed here.
One thing is worth knowing before you read the table on this page. The twelve-row schedule and the headline are computed the same way: each row subtracts the exemption you entered from that row's value and applies the 1.07% rate to what is left. With a $400,000 home and a $25,000 exemption the headline returns $4,012.50, and row 6 of the schedule, the row sitting at exactly $400,000 of value, returns $4,012.50 as well. Row 1 moves from $713.33 to $445.83 under the same entry. The column is a single series in the value you enter, so it rises without interruption from row 1 to row 12 and can be compared row to row.
Worked Example
Using this calculator's baseline inputs: a $400,000 home in Rhode Island, taxed at the state's 1.07% average effective rate (rank #15 of 50 states).
- Start with the assessed value. The home is assessed at its full $400,000.00 market value, with no homestead exemption applied in this baseline scenario.
- Apply the effective rate. $400,000.00 × 1.07% = $4,280.00 in annual property tax, Rhode Island's statewide average effective rate.
- Convert to a monthly escrow. Lenders typically collect property tax in twelve equal installments alongside principal and interest: $4,280.00 ÷ 12 = $356.67 per month.
- Now apply the built-in exemption scenario. Entering the $25,000 homestead exemption drops the taxable assessed value to $375,000.00 and the annual figure to $4,012.50, a saving of $267.50 a year. Monthly escrow moves from $356.67 to $334.38.
- Check that against the schedule. Row 6 of the twelve-row table, the row priced at $400,000 of value, shows $4,012.50 in that same scenario, matching the headline to the cent, because the schedule subtracts the exemption before applying the 1.07% rate exactly as the headline does.
At 1.07%, Rhode Island lands roughly in the middle nationally, ranking #15 of 50 states. That is a moderate but still material carrying cost for homeowners.
Walking the Exemption Down to Zero
Nothing on this page has a bracket in it. 1.07% is charged on the first taxable dollar and on the last one, so the interesting numbers here are the slopes and the one genuine cliff the exemption input creates.
The next $10,000 of assessed value. Sweeping assessedHomeValue from $400,000 to $440,000 in $10,000 steps with a $25,000 exemption held constant, the annual figure starts at $4,012.50, then rises by exactly $107.00 at every stop. That is the whole marginal story: each additional $10,000 of assessed value in Rhode Island costs $107.00 a year, at any value the input accepts.
The reverse question, in value terms. Sweeping value with no exemption, $300,000 returns $3,210.00, $400,000 returns $4,280.00, $500,000 returns $5,350.00 and $600,000 returns $6,420.00. To land on a target annual bill, divide it by 1.07%; the sweep confirms the relationship stays exactly linear across the whole input range because there is no second tier to cross.
The next $25,000 of exemption. Sweeping homesteadExemption from $0 to its $200,000 maximum on a $400,000 home, the bill starts at $4,280.00 and falls by $267.50 at every $25,000 step, with no step larger or smaller than any other. At the $200,000 cap the annual figure is $2,140.00, exactly half the unexempted bill, because $200,000 of exemption removes exactly half of a $400,000 taxable base.
The threshold walk, at the one place a real cliff exists. Take a $150,000 Rhode Island home and push the exemption past the value. At a $145,000 exemption the annual tax is $53.50 on the $5,000 of taxable value that survives. At $147,500 it is $26.75. At $150,000 it is $0.00. Every further dollar of exemption past $150,000 is worth nothing at all: $152,500, $155,000 and $160,000 all return $0.00, because max(0, value - exemption) floors the taxable base at zero rather than letting it go negative. That is the only discontinuity in the model, and it is a slope that runs at $107.00 per $10,000 of value right up to the line and at zero past it, not a bracket edge.
Right method against wrong method, priced. The common error is applying the 1.07% rate to the market value and then subtracting the exemption's worth afterwards, or forgetting the exemption ordering altogether. On a $400,000 home with a $25,000 exemption the calculator returns $4,012.50. Running 1.07% against the full $400,000 first returns $4,280.00. The gap is $267.50 a year overstated on a single bill purely from applying the rate before the subtraction rather than after it. The schedule subtracts the exemption first as well, so its row-6 figure comes back at $4,012.50 and agrees with the headline rather than reproducing that error.
What This Does Not Account For
- Municipal classified tax rates. Rhode Island has no state-mandated homestead exemption; several cities, Providence and Cranston among them, instead tax owner-occupied homes at a lower classified rate than non-owner-occupied property. The
homesteadExemptionfield here is a flat dollar subtraction worth $267.50 a year per $25,000 entered, not a rate reclassification, so a classified-rate municipality cannot be modelled on this page at all. - Locally set senior and veteran relief. Rhode Island cities and towns set their own senior, surviving-spouse and disabled-veteran programs, and several operate as tax freezes rather than dollar exemptions. A freeze has no representation in this engine, which has exactly two inputs.
- Specific hyper-local county and municipal millage district variations within Rhode Island.
- Special assessment or improvement district charges. Some Rhode Island municipalities levy additional assessments on benefiting parcels for street, drainage, or sewer improvements on top of the base municipal rate; the specific list of districts varies by municipality.
- Commercial vs residential assessment classification differentials.
- Property tax appeal reductions or localized board of equalization adjustments.
Common Pitfalls
- Confusing Market Fair Value with Assessed Basis: Some jurisdictions assess property at fractional ratios rather than 100% of market value.
- Failing to File Homestead Paperwork: Homestead exemptions are rarely automatic; homeowners must file timely paperwork with the county appraisal district.
- Underestimating Post-Sale Supplemental Assessments: Purchasing a newly constructed or reassessed property often triggers catch-up supplemental tax bills.
- Ignoring Property Tax Appeal Windows: Missing the annual 30-to-60 day statutory protest window forfeits the right to challenge over-assessed property values for that tax year.
Frequently Asked Questions
How high are property taxes in Rhode Island?
When are property taxes due in Rhode Island?
How can I lower my property taxes in Rhode Island?
Does purchasing a home trigger a property tax reassessment?
Sources
- U.S. Census Bureau: American Community Survey (ACS) Real Estate Assessment Benchmark Data. census.gov/programs-surveys/acs
Also consulted: Rhode Island Division of Municipal Finance: Assessment Ratio Manuals.