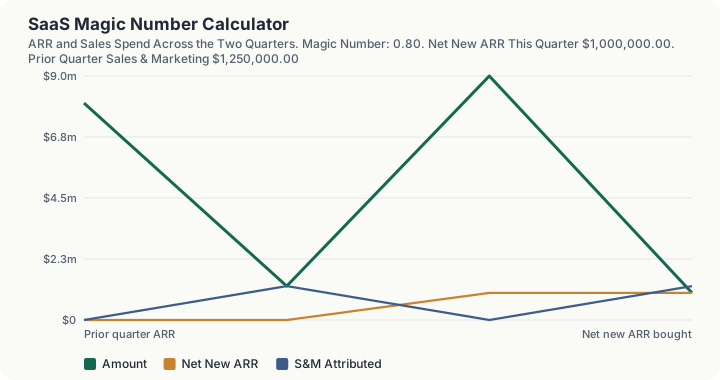
Quick Answer: ARR moving from $8,000,000 to $9,000,000 on $1,250,000 of sales and marketing spend in the earlier quarter gives a magic number of 0.80, inside the "Efficient (0.75 to 1.0)" band. It implies a 15.0 month gross payback, or 20.0 months once the 75% gross margin is applied, and it cost $1.25 of sales and marketing to buy each dollar of new ARR.
What does this calculator do?
The magic number asks one question: how much new annual recurring revenue did a dollar of sales and marketing buy? It is the standard board-level measure of go-to-market efficiency, and its real value is that it is a payback period wearing a disguise: a magic number of 0.80 and a fifteen-month payback are the same statement.
The metric deliberately uses a one-quarter lag. Spend in one quarter produces revenue in the next, so the denominator is the earlier quarter's sales and marketing cost, not the current quarter's. Getting that lag backwards is the most common way the number is computed wrong, and it systematically flatters a company that is accelerating spend.
The metric also has two structural biases, both of which make it look better than reality. It counts revenue, not gross profit, and only gross profit can repay an investment. And it attributes all net new ARR to sales and marketing, including expansion from existing customers and organic signups no salesperson touched. This calculator surfaces both: it reports a margin-adjusted payback alongside the raw one, and this page is explicit about the attribution assumption.
How is this calculated?
Magic number = (ARR_Qₙ − ARR_(Q_(n − 1)))/(S&M_(Q_(n − 1)))
Step 1: Compute net new ARR. $9,000,000 − $8,000,000 = $1,000,000
Step 2: Divide by the prior quarter's sales and marketing spend. $1,000,000 ÷ $1,250,000 = 0.80
Step 3: Place it in an efficiency band. 0.80 falls between 0.75 and 1.0: Efficient (0.75 to 1.0)
Step 4: Convert the ratio to an implied gross payback period. The magic number is the reciprocal of a payback measured in years, so twelve divided by it gives months: $12 \div 0.80 = $ 15.0 months
Step 5: Adjust that payback for gross margin. Only margin repays spend, so divide by the magic number times the margin: $12 \div (0.80 \times 0.75) = $ 20.0 months
Step 6: Invert the ratio for a cost per dollar of new ARR. $1,250,000 ÷ $1,000,000 = $1.25 of spend per $1 of new ARR
Step 7: Compute the quarterly growth rate. $1,000,000 ÷ $8,000,000 = 12.50%
Step 8: Compound that across four quarters. $(1 + 0.125)^4 - 1 = $ 60.18% implied annual growth This is a projection of the observed quarterly rate, not a forecast and not derived from the magic number.
If prior-quarter spend is zero the ratio has no denominator, and the calculator reports the magic number as undefined rather than infinite.
Worked Example
A Series B company closes its second quarter at $8,000,000 of ARR and its third at $9,000,000. Sales and marketing in the second quarter (fully loaded, including quota-carrying salaries, commissions, demand generation and the marketing team) was $1,250,000. Gross margin is 75%.
Step 1: Net new ARR. $9,000,000 − $8,000,000 = $1,000,000
Step 2: The ratio. $1,000,000 ÷ $1,250,000 = 0.80
Step 3: What that costs per dollar bought. $1.25 of spend for every $1.00 of new ARR
Step 4: Gross payback. $12 ÷ 0.80 = 15.0 months of new revenue to repay the quarter's spend
Step 5: The honest payback. Only 75 cents of each new revenue dollar is gross profit: $12 ÷ (0.80 x 0.75) = 20.0 months Five months longer than the raw figure suggests, and that gap widens fast at lower margins.
Step 6: Growth implied. 12.50% for the quarter, or 60.18% annualised if the pace holds.
Now vary the spend and hold the growth constant. Buying the same $1,000,000 of new ARR on $500,000 of spend gives a magic number of 2.00 and a 6.0-month payback: exceptional, and usually a sign the company is under-investing and leaving growth unclaimed. Buying it on $2,500,000 gives 0.40 and a 30.0-month payback, which is the inefficient band: two and a half years of revenue to repay a single quarter of spend, before margin is even considered. And if ARR had fallen to $7,600,000 while spend continued, the magic number would be −0.32 and no payback period would exist at all, because churn is outrunning acquisition and more spend does not fix that.
What does this calculator not account for?
- It attributes all net new ARR to sales and marketing. Expansion revenue from existing customers, organic signups, word-of-mouth and product-led growth all land in the numerator regardless of whether any sales dollar produced them. A product-led company will show a flattering magic number for reasons unrelated to sales efficiency.
- It nets churn against new business. Net new ARR is a single figure, so a quarter with excellent new sales and severe churn looks identical to a mediocre quarter with none. The metric cannot distinguish an acquisition problem from a retention problem.
- The raw ratio ignores gross margin entirely. The margin-adjusted payback on this page corrects for that, but the headline number itself does not, and it is the headline number that gets quoted in board decks.
- A one-quarter lag is an assumption, not a measured sales cycle. For a business with a nine-month enterprise sales cycle, the spend that produced this quarter's revenue was largely incurred three quarters ago, and the metric mis-attributes accordingly.
- The annualised growth figure simply compounds one quarter four times. It is arithmetic on a single observation, not a forecast, and it says nothing about seasonality or pipeline.
- Nothing here is a cash flow model. Payback in months of revenue is not the same as payback in cash, which depends on billing terms, collections and whether contracts are paid annually up front.
- There is no benchmark data behind the bands. The 0.5, 0.75 and 1.0 boundaries are widely used industry conventions, not measured percentiles from any published dataset.
What mistakes do people make with this?
- Using the current quarter's spend in the denominator. The lag is the whole point. A company ramping spend hard will look far more efficient than it is if the lag is dropped.
- Quoting the raw magic number as a payback period. A 0.80 magic number is a 15-month payback on revenue and a 20-month payback on gross profit. The second is the one that matters to a lender or an investor.
- Under-loading sales and marketing cost. Commissions, sales engineering, sales operations, marketing headcount and tooling all belong in the denominator. Excluding them inflates the ratio directly.
- Reading a very high magic number as unambiguously good. Above 1.0 usually means the company could profitably spend more and is not doing so. Sustained figures above 2.0 more often indicate under-investment than exceptional execution.
- Comparing across business models. A self-serve product with a two-week sales cycle and an enterprise product with a nine-month cycle are not measured on the same footing by this metric.
- Optimising the metric rather than the business. Cutting sales and marketing raises the magic number mechanically while shrinking the company.
Frequently Asked Questions
What is a good magic number?
Why is the prior quarter's spend used instead of the current quarter's?
How does the magic number relate to CAC payback?
Should I use gross margin in the calculation?
What does a negative magic number mean?
Can I compute this from quarterly revenue instead of ARR?
Sources
- U.S. Small Business Administration, the official authority for the business this calculator relates to. sba.gov
Also consulted: The definition used, net new ARR for the quarter divided by the prior quarter's sales and marketing spend, is the standard formulation of the magic number in SaaS financial analysis, and it is the definition implemented in this repository's saas-magic-number primitive; The identity between the magic number and payback period, gross payback months equals twelve divided by the magic number, follows directly from that definition and is asserted by the primitive's test vectors; The efficiency bands at 0.5, 0.75 and 1.0 are widely used industry conventions. No published dataset underlies them, and they should be treated as rules of thumb rather than benchmarks.
This calculator implements pure growth-efficiency arithmetic. There is no statutory or regulatory data behind it, and no figure on this page comes from a government or standards body.