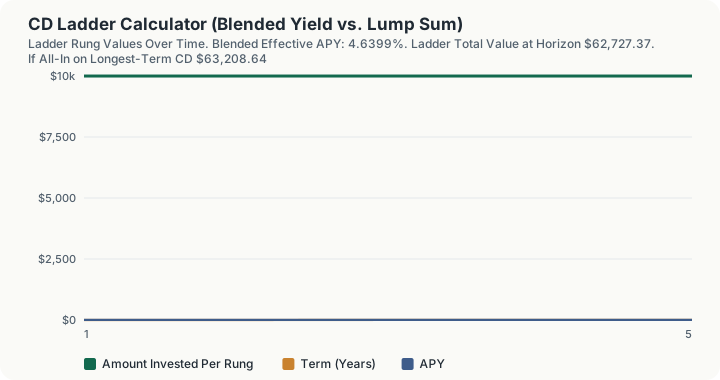
Quick Answer: Splitting $50,000 across a 5-rung CD ladder (1 through 5-year terms, rates stepping from 4.0% to 4.8%) grows to $62,727.37 over 5 years, a 4.6399% blended effective APY. That beats leaving the same money fully liquid at 3.5% by $3,343.05, while giving up only $481.27 versus locking the entire amount into a single 5-year CD from day one.
Overview
A CD ladder splits a lump sum across several certificates of deposit with staggered maturities instead of putting it all into one CD term. The tradeoff it's built to solve: longer CDs pay higher rates but lock your money up longer, while keeping everything liquid earns the lowest rate of all but leaves you free to move funds any time. Laddering captures part of the higher long-term rate while still having a rung mature on a regular schedule, giving you periodic access to cash and periodic chances to reinvest at whatever rate is then available. This calculator models a full ladder cycle, splitting your total investment evenly across rungs maturing at staggered terms, and compares the ladder's blended return against two alternatives: putting the whole amount into a single long-term CD, or leaving it all liquid.
How This Is Calculated
Ladder construction. The total investment is split into $N$ equal-dollar rungs. Rung $i$ (for $i = 1$ to $N$) matures at $i$ term-increments, and its rate is linearly interpolated between the shortest-term rate (rung 1) and the longest-term rate (rung $N$), reflecting a normal, upward-sloping rate curve where longer commitments earn more.
Each rung's future value at its own maturity, via the standard compound-interest formula (the platform's shared future-value function, solveFV):
where $P_i$ is the rung's principal, $r_i$ its annual rate, and $t_i$ its term in years.
Reinvestment to the ladder horizon. To compare the ladder against a single lump-sum alternative fairly, each rung's proceeds are modeled as reinvested, upon maturity, into a new CD at the ladder's current longest-rung rate for the remaining time until the full ladder horizon (the longest rung's original term). This models an ongoing, steady-state ladder rather than a one-time snapshot.
Blended effective APY is the compound annual growth rate (CAGR) that takes the total initial investment to the ladder's total ending value over the full horizon:
The two comparison figures use the same solveFV compounding primitive applied to the full investment amount at a single rate for the full horizon: once at the longest rung's rate (the "all-in-longest" comparison), and once at your stated liquid savings rate (the "all-liquid" comparison).
Worked Example
A saver with $50,000 sitting in cash does not want to lock it all away for five years, but resents the 3.5% the money market is paying. A five-rung annual ladder is the usual compromise: rates step from 4.0% on the one-year rung to 4.8% on the five-year rung.
Step 1 -- Size each rung. $50,000 / 5 rungs = $10,000 per rung
Step 2 -- Interpolate the rate curve. (4.8% - 4.0%) / 4 gaps = 0.2 points per rung, giving 4.0%, 4.2%, 4.4%, 4.6%, 4.8%
Step 3 -- Rung 1 at its own maturity. $10,000 x (1.040)^1 = $10,400.00
Step 4 -- Rung 1 reinvested to the horizon. $10,400.00 x (1.048)^4 = $12,545.23
The Second Rung, and the Running Total
Step 5 -- Rung 2 at its own maturity. $10,000 x (1.042)^2 = $10,857.64
Step 6 -- Rung 2 reinvested for its remaining 3 years. $10,857.64 x (1.048)^3 = $12,497.39
Step 7 -- Running ladder total after two rungs. $12,545.23 + $12,497.39 = $25,042.62
Notice that rung 2 finishes slightly behind rung 1 despite starting at a higher rate. Rung 1 spends four of its five years at the top 4.8% reinvestment rate; rung 2 only spends three. The remaining rungs land at $12,497.53, $12,545.50 and $12,641.73, which is why the five-rung total is so tightly clustered.
Step 8 -- Ladder total at the 5-year horizon. Summing all five rungs = $62,727.37
Step 9 -- Blended effective APY. ($62,727.37 / $50,000)^(1/5) - 1 = 4.6399%
Against the Two Alternatives
Step 10 -- All-in on the longest CD. $50,000 x (1.048)^5 = $63,208.64
Step 11 -- The yield given up. $63,208.64 - $62,727.37 = $481.27
Step 12 -- Staying fully liquid. $50,000 x (1.035)^5 = $59,384.32
Step 13 -- The ladder advantage over cash. $62,727.37 - $59,384.32 = $3,343.05
The blended 4.6399% sits much nearer the 4.8% top rate than the 4.0% bottom one, because most of the money spends most of its life at the reinvestment rate rather than at its original rung rate. The trade is legible in steps 11 and 13: $481.27 of foregone yield buys a rung maturing every twelve months, against $3,343.05 gained over doing nothing at all.
Why Ladder Instead of Choosing One CD Term
The ladder's real advantage isn't raw yield, it usually loses slightly to an all-in-longest strategy, as this worked example shows. The advantage is flexibility under uncertainty. If rates rise after you lock in, only one-fifth of your money is stuck at the old rate at any given time; the next maturing rung lets you reinvest at the new, higher rate. If you unexpectedly need cash, you're never more than a year (or your chosen increment) away from a rung maturing without penalty, instead of facing an early-withdrawal penalty on the entire sum. A single long-term CD offers a slightly higher expected return only if rates stay flat or fall and you never need the money early; the ladder trades a small amount of that expected return for meaningfully lower interest-rate risk and liquidity risk.
What This Does Not Account For
- Early withdrawal penalties. If you break a CD before its maturity date, most banks charge a penalty (commonly 3 to 12 months of interest); this calculator assumes every rung is held to full maturity.
- Changing reinvestment rates in reality. The model assumes every maturing rung reinvests at today's stated longest-term rate; actual future CD rates will differ, and could be higher or lower than assumed here.
- FDIC/NCUA insurance limits. Standard deposit insurance covers $250,000 per depositor, per insured institution, per ownership category; a large ladder at a single bank may need to be split across institutions to stay fully insured.
- Taxes on interest income. CD interest is taxed as ordinary income in the year it's credited, even if the CD hasn't matured yet for multi-year CDs that credit interest annually; this calculator shows pre-tax growth only.
- Uneven rung sizing or promotional rate structures. This calculator assumes equal dollar amounts per rung and a smooth linear rate curve between shortest and longest terms; real banks sometimes offer non-linear promotional rates on specific terms.
Common Pitfalls
- Comparing only the ladder's blended APY to the longest CD's rate. The blended APY will almost always be lower than the single longest-term rate; that's not a flaw in the ladder, it's the direct cost of keeping some money more liquid, exactly the tradeoff this calculator is built to quantify.
- Assuming reinvestment rates will match today's rates. The "ladder total value" figure is a projection based on today's longest-term rate holding steady for future reinvestments; if rates fall meaningfully, actual results will be lower than shown.
- Building a ladder that's too short to smooth out rate cycles. A 2-rung, 1-year ladder barely diversifies interest rate risk; the benefit of laddering grows with more rungs spread over a longer total horizon.
- Ignoring early withdrawal penalties when comparing to a fully liquid account. The "all-liquid" comparison figure assumes true liquidity with no penalty; a CD ladder's rungs are not accessible penalty-free before their individual maturity dates.
Frequently Asked Questions
How many rungs should a CD ladder have?
What happens to my money at the end of the ladder horizon?
Is a CD ladder better than a single long-term CD?
Why do the rates increase linearly between the shortest and longest rung?
Can I use this for a bond ladder instead of a CD ladder?
Sources
- Federal Deposit Insurance Corporation (FDIC), deposit insurance coverage limits and rules. fdic.gov
- Consumer Financial Protection Bureau, certificates of deposit and early withdrawal penalty guidance. consumerfinance.gov
- Federal Reserve Bank of St. Louis (FRED), historical CD and deposit rate data. federalreserve.gov
Also consulted: FINRA Investor Education, CD laddering strategies.