Quick Answer: California's cost of living is 40.5% above the U.S. national average (composite index 140.5), so a $75,000.00 national-average household budget costs about $105,375.00 a year in California.
One Number Hiding a Very Lopsided State
California's composite cost-of-living index is 140.5, 40.5% above the 100.0 national baseline and 3rd of 50 on cost.
The composite conceals how uneven the state is. Housing prices at 196.5, close to double the national level. Utilities are 126.8 and groceries 114.2, both expensive, neither remotely at the housing figure. The distance between 140.5 and 196.5 is the single most consequential fact on this page, because the calculator returns the first number and a household paying market rent in a coastal metro is exposed to the second.
At the default $75,000 baseline the engine returns $105,375.00, a differential of $30,375.00. That comes from multiplying by 140.5 and dividing by 100. Nothing in the code touches the 196.5 when producing it.
Key Index Components for California:
- Composite Benchmark Index: 140.5 (Rank #3)
- Housing Cost Index: 196.5
- Utilities Cost Index: 126.8
- Grocery Cost Index: 114.2
How This Is Calculated
Housing at 196.5 is nearly double the national level, while groceries at 114.2 and utilities at 126.8 are expensive but nothing like that. Rank 3 nationally. The tool scales your budget by the composite of 140.5, not by the housing figure.
- Baseline budget. You enter annual household spending priced at the national benchmark, index 100.0.
- Composite lookup. California's composite index of 140.5 is read from the 2026 MERIC state table, along with its rank of #3 among the 50 states.
- Single-factor scaling. The baseline is multiplied by 140.5 and divided by 100. That is the entire calculation. Housing 196.5, groceries 114.2 and utilities 126.8 are separate index ratios displayed for context; the engine performs no apportionment of your budget across categories and applies no weights to them.
- Differential. The dollar and percentage difference against the baseline are taken from the scaled result. The percentage output is +40.5% at every budget the tool accepts.
Worked Example
Using this calculator's baseline scenario: a household needing $75,000.00 a year to sustain a standard basket of goods, priced at the U.S. national average (composite index 100.0).
- National baseline. $75,000.00 is the reference spending level at the national-average price level (index 100.0).
- Apply California's composite index. California's composite index of 140.5 (rank #3 nationally) means local prices run 40.5% above the national basket. Scaling: $75,000.00 × (140.5 ÷ 100) = $105,375.00.
- Dollar differential. The engine returns +$30,375.00, the amount by which the budget has to grow to hold the same basket.
- Percentage. That is +40.5%, and it is the same percentage at every budget size.
Following the Premium Up the Sweep
There is no bracket, cap or phase-out in this calculator. It is one linear multiplication, and what the sweep shows is not an edge but the sheer scale of the premium as budgets grow:
| Baseline entered | California adjusted | Differential |
|---|---|---|
| $10,000 | $14,050.00 | $4,050.00 |
| $50,000 | $70,250.00 | $20,250.00 |
| $75,000 | $105,375.00 | $30,375.00 |
| $100,000 | $140,500.00 | $40,500.00 |
| $150,000 | $210,750.00 | $60,750.00 |
| $200,000 | $281,000.00 | $81,000.00 |
Every row returns a composite of 140.5 and a differential of 40.5%. The premium never tapers. At a $200,000 baseline the differential alone, $81,000.00, exceeds the entire $75,000 default budget.
The next thousand dollars. A $75,000 baseline returns $105,375.00 and a $76,000 baseline returns $106,780.00. That step is the marginal cost in California of one more thousand dollars of national-baseline spending, and it is constant along the whole line.
The Reverse Question: What a California Budget Is Worth Elsewhere
For anyone leaving the state, or negotiating an offer to enter it, the useful direction is the inverse. What national-average budget does $75,000 of California spending represent?
Running the calculator to the dollar:
- A baseline of $53,380 returns $74,998.90.
- A baseline of $53,381 returns $75,000.31.
$75,000 spent in California therefore buys roughly what $53,381 buys at national-average prices. That is the figure to hold onto when a relocation package quotes a nominal salary: a $105,375.00 California budget and a $75,000 national budget are the same standard of living under this index, which is exactly what the forward run at $75,000 returns.
Dividing by the Index Versus Subtracting the Premium
California is where the symmetry error does the most damage, because the differential is the largest of the seven states in this series.
The wrong method subtracts the premium from the California figure: 40.5% above national, so $75,000 minus 40.5% gives $44,625 of national baseline. Run $44,625 through the engine and it returns $62,698.13, a long way short of the $75,000 target.
The right method divides by the index, and the verified pair is $53,381 in, $75,000.31 out. The distance between the $44,625 the wrong method produces and the $53,381 the engine confirms is the cost of that single mistake, and it grows with the size of the differential, which is why the error matters more on this page than on any other state in this index.
Reading the Multiplier Schedule Table
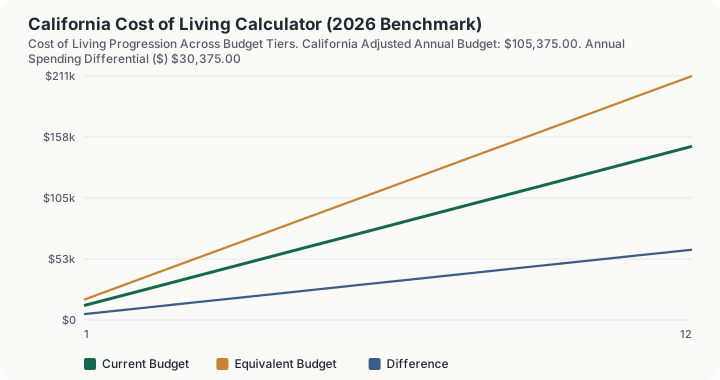
The 12-row table under the calculator is one clean series. Each row i prices a budget tier of budget × i ÷ 6 and applies the same composite 140.5 to it, so the middle column is a straight line through the origin and can be read straight down.
At the default $75,000 baseline the tiers step $12,500.00 at a time. Row 1 prices $12,500.00 and returns $17,562.50. Row 4 prices $50,000.00 and returns $70,250.00. Row 6 prices exactly the $75,000.00 you entered and returns $105,375.00, which is the headline to the cent. Row 12 prices $150,000.00 and returns $210,750.00. Every row is the identical 1.405 multiple, so the column rises monotonically and nothing in it needs interpreting.
The difference column is proportional in the same way: always 40.5% of that row's tier, running from $5,062.50 at row 1 to $60,750.00 at row 12. Because both columns scale with the tier, row 8's $140,500.00 on a $100,000.00 tier is exactly row 4 doubled, and any two rows stand in the same ratio as their budgets.
What the table does not contain is any of the other three indices. Housing 196.5, groceries 114.2 and utilities 126.8 are printed on this page as context for where the composite came from; they are never multiplied by anything, in the table or in the headline. The single arithmetic operation behind every figure on this page is budget times 140.5 divided by 100.
What This Does Not Account For
- A single statewide multiplier. San Francisco, Los Angeles, Fresno and Bakersfield all receive the identical 140.5. There is no metro, county or ZIP input anywhere in this calculator, and California's internal dispersion is larger than most states' distance from the national average.
- No category weighting. The engine does not know your rent or what fraction of your budget is housing. A renter facing the 196.5 gets the same 140.5 answer as an owner with a low fixed payment under Proposition 13.
- No taxes. California's graduated income tax, its combined state and local sales tax, and property tax are all absent from this figure. Each is computed by a separate calculator on this site.
- No date, no inflation. The 140.5 is a static table value. This config is not tax-year sensitive and takes no year input, so nothing here projects the index forward.
- No wage side. The tool has no salary input and makes no claim that California incomes offset the 40.5% premium.
Common Pitfalls
- Budgeting a coastal rent against the composite. The composite is 140.5; housing is 196.5. The gap between those two numbers is the reason a household that rents at market rate routinely overruns the answer this page returns.
- Reversing by subtraction. $44,625 returns $62,698.13, not $75,000. The verified inverse of $75,000 is a baseline of $53,381.
- Reading a table row as a housing cost. Row 2's $35,125.00 is a $25,000.00 budget tier priced at the composite, not a California rent. The housing index of 196.5 is nowhere in that column.
- Assuming the premium eases at higher budgets. It is 40.5% at $10,000 and 40.5% at $200,000, where the differential alone reaches $81,000.00.
Frequently Asked Questions
Is California expensive to live in?
What is the biggest cost factor in California?
How much salary do I need to maintain my lifestyle in California?
Does the 40.5% premium shrink at higher incomes?
Sources
- U.S. Bureau of Economic Analysis (BEA): Regional Price Parities. bea.gov/data/prices-inflation/regional-price-parities-state-and-metro-area
- U.S. Bureau of Labor Statistics (BLS): Consumer Expenditure Survey. bls.gov/cex
- California Franchise Tax Board, the official state tax authority for California rates, rules and forms. ftb.ca.gov
Also consulted: MERIC: Cost of Living Data Series (2025/2026), composite index 140.5, rank #3.