Quick Answer: Colorado's cost of living is 5.6% above the U.S. national average (composite index 105.6), so a $75,000.00 national-average household budget costs about $79,200.00 a year in Colorado.
A Composite Built From Categories That Disagree
Composite index: 105.6. Colorado runs 5.6% above the national baseline of 100.0 and ranks 16th of 50 on cost.
The published sub-indices point in opposite directions, which is unusual and is the most useful thing on this page. Housing is 119.4, nearly 20 points above parity. Utilities are 92.5, below it. Groceries sit at 101.2, effectively on the line. Colorado is one of the few above-average states where a category is materially cheaper than the national average.
At the default $75,000 baseline the engine returns $79,200.00 and a differential of $4,200.00. It reaches that by multiplying by 105.6 and dividing by 100. The 119.4 and the 92.5 do not enter that arithmetic at any point.
Key Index Components for Colorado:
- Composite Benchmark Index: 105.6 (Rank #16)
- Housing Cost Index: 119.4
- Utilities Cost Index: 92.5
- Grocery Cost Index: 101.2
How This Is Calculated
Housing is 119.4 while utilities are 92.5, well under the national line, and groceries sit at 101.2. The composite of 105.6 is the published netted result, rank 16 of 50, and it is the number the calculator multiplies your budget by.
- Baseline budget. You enter annual household spending priced at the national benchmark, index 100.0.
- Composite lookup. Colorado's composite index of 105.6 is read from the 2026 MERIC state table, along with its rank of #16 among the 50 states.
- Single-factor scaling. The baseline is multiplied by 105.6 and divided by 100, and that is the whole computation. Housing 119.4, groceries 101.2 and utilities 92.5 are independent index ratios reported for context. The engine does not weight them, does not net them against each other, and does not divide your budget between them.
- Differential. The dollar and percentage difference against the baseline are read off the scaled result, and the percentage is +5.6% at every budget the tool accepts.
Worked Example
Using this calculator's baseline scenario: a household needing $75,000.00 a year to sustain a standard basket of goods, priced at the U.S. national average (composite index 100.0).
- National baseline. $75,000.00 is the reference spending level at the national-average price level (index 100.0).
- Apply Colorado's composite index. Colorado's composite index of 105.6 (rank #16 nationally) means local prices run 5.6% above the national basket. Scaling: $75,000.00 × (105.6 ÷ 100) = $79,200.00.
- Dollar differential. The engine returns +$4,200.00, the amount by which the budget has to grow to hold the same basket.
- Percentage. That is +5.6%, constant across the full input range.
A Sweep With Nothing In It: The Line From $10,000 to $200,000
Calculators elsewhere on this site have bracket edges worth walking. This one has none: there is no threshold, no cliff and no cap anywhere in the code, so the honest report is the line itself and the fact that it never bends.
- $10,000 baseline returns $10,560.00, differential $560.00.
- $50,000 returns $52,800.00, differential $2,800.00.
- $75,000 returns $79,200.00, differential $4,200.00.
- $120,000 returns $126,720.00, differential $6,720.00.
- $200,000 returns $211,200.00, differential $11,200.00.
Composite 105.6 and differential 5.6% at every one of those points. Colorado's premium is small enough that at the $10,000 floor the whole annual differential is $560.00, which is a useful corrective to the state's reputation: the statewide index is barely above average, and the Front Range housing story is carried by the 119.4 sub-index rather than by the composite this tool returns.
The next thousand dollars. A $75,000 baseline returns $79,200.00; a $76,000 baseline returns $80,256.00. That is the marginal cost in Colorado of one more thousand dollars of national-baseline spending, and it does not change anywhere along the sweep.
Solving It Backwards From a Denver Budget
The reverse question is the more actionable one for anyone already in the state. What national baseline corresponds to $75,000 of Colorado spending?
Running the engine to the dollar:
- A baseline of $71,022 returns $74,999.23.
- A baseline of $71,023 returns $75,000.29.
So $75,000 spent in Colorado is about $71,023 of national-baseline spending. In the forward direction, the pairing the Quick Answer states is the other side of the same relationship: $75,000 of national baseline costs $79,200.00 here.
The Subtraction Trap, With Figures
Colorado's differential is small, which makes the standard reversal error easy to commit and easy to miss.
Reasoning that Colorado is 5.6% above national and therefore $75,000 minus 5.6%, or $70,800, is the national equivalent gives the wrong base. Feed $70,800 to the engine and it returns $74,764.80, under the $75,000 target rather than on it.
The correct inverse divides by the index, and the verified pair is $71,023 in and $75,000.29 out. At Colorado's 105.6 the discrepancy is modest, but the method is the same one that misprices a budget badly in a state at 140.5, and it is worth getting right where the stakes are low.
What the Multiplier Schedule Table Actually Contains
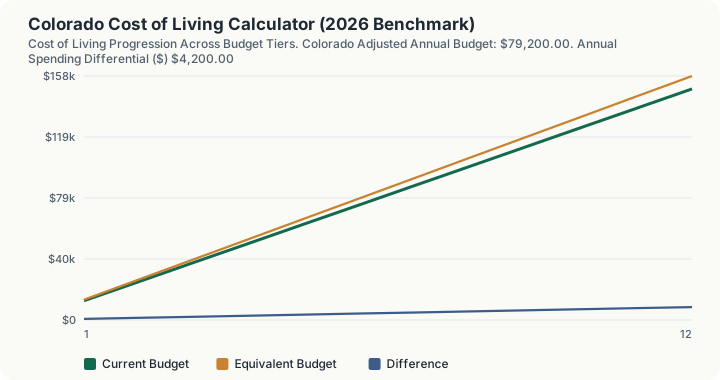
The 12-row table below the calculator changes one thing per row, the budget, and reads as a single series from top to bottom.
Row i scales the baseline to budget × i ÷ 6 and prices it at the composite 105.6, on every row. At the default $75,000 that gives $12,500.00 steps: row 1 prices $12,500.00 and returns $13,200.00; row 2 prices $25,000.00 and returns $26,400.00; row 4 prices $50,000.00 and returns $52,800.00; row 6 prices the entered $75,000.00 and returns $79,200.00, matching the headline; row 12 prices $150,000.00 and returns $158,400.00.
The difference column is positive on all twelve rows and equals 5.6% of that row's tier: $700.00 at row 1, $2,800.00 at row 4, $4,200.00 at row 6, $8,400.00 at row 12. There is no sign flip anywhere in the schedule, because the only index it ever applies is the composite, and the composite is above 100.
That is worth stating plainly, because Colorado is a state where the categories disagree sharply. Housing prices at 119.4, groceries at 101.2 and utilities at 92.5, so one published category sits below the national line inside an above-parity state. That disagreement is genuinely the most interesting thing about Colorado's cost structure, and it is also invisible to your result: the engine multiplies your budget by the composite alone, the three sub-indices are printed as context, and no row of the table and no output on this page blends them in any proportion.
What This Does Not Account For
- One statewide multiplier. Denver, Boulder, Colorado Springs and a Western Slope county all receive the identical 105.6. There is no metro, county or ZIP input.
- No category weighting. The engine does not know what share of your budget is rent, so a renter exposed to the 119.4 and an owner benefiting from the 92.5 receive the same answer.
- No taxes. Colorado's flat income tax, its layered state and local sales taxes, and residential property assessment are all outside this figure and are handled by separate calculators here.
- No time dimension. The 105.6 is a static table value; this config is not tax-year sensitive and offers no year or inflation input.
- No altitude or commute effects. Mountain-community pricing, which is the largest source of within-state variance in Colorado, is invisible to a single statewide index.
Common Pitfalls
- Treating 105.6 as a Front Range housing figure. Housing is 119.4. The composite is dragged down by the 92.5 utilities reading, and a renter never sees that offset.
- Reversing by subtraction. $70,800 returns $74,764.80, not $75,000. The verified inverse is $71,023.
- Expecting the 92.5 utilities reading to show up in your answer. It does not. Every figure the calculator returns, headline and table alike, is priced at the 105.6 composite.
- Expecting the premium to grow with income. It is 5.6% at $10,000 and 5.6% at $200,000.
Frequently Asked Questions
Is Colorado expensive to live in?
What is the biggest cost factor in Colorado?
How much salary do I need to maintain my lifestyle in Colorado?
Does the 5.6% figure change at higher budgets?
Sources
- U.S. Bureau of Economic Analysis (BEA): Regional Price Parities. bea.gov/data/prices-inflation/regional-price-parities-state-and-metro-area
- U.S. Bureau of Labor Statistics (BLS): Consumer Expenditure Survey. bls.gov/cex
- Colorado Department of Revenue, the official state tax authority for Colorado rates, rules and forms. tax.colorado.gov
Also consulted: MERIC: Cost of Living Data Series (2025/2026), composite index 105.6, rank #16.