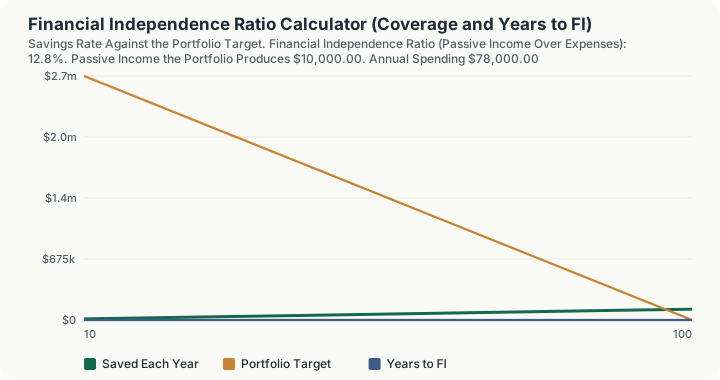
Quick Answer: A $250,000 portfolio against $78,000 of annual spending covers 12.8% of the way to financial independence: it throws off $10,000 a year at a 4% withdrawal rate. Full independence needs $1,950,000, leaving $1,700,000 still to accumulate, which at a 35% savings rate on $120,000 of income and a 5% real return takes 19.3 years.
What does this calculator do?
The financial independence ratio answers a narrower and more useful question than "am I on track". It asks what fraction of your spending your portfolio already pays for. At 100% the portfolio covers your life and the job becomes optional. Below that, the ratio tells you how much of the way there you are, in a single figure that does not move when your income moves.
That last property is what makes it worth computing separately from a net worth number. Net worth rises with a windfall. The independence ratio only rises when the portfolio grows relative to what you actually spend, which is the thing that has to happen.
The second half of the page is the time question, and it is where the savings rate does something that surprises people. Raising the savings rate does not just increase what you put in. It simultaneously reduces what you spend, and because the target is spending divided by the withdrawal rate, it lowers the finish line at the same time as it speeds you toward it. That two-sided effect is why years to independence depends far more steeply on the savings rate than on the expected return, and why the table on this page sweeps the savings rate rather than the return.
One caveat on the inputs. Use a real, after-inflation return if you want an answer in today's money, and treat the safe withdrawal rate as an assumption rather than a rule. The 4% figure comes from historical US backtests over thirty-year horizons. No authority publishes it.
How is this calculated?
FI Ratio = (P × w)/E × 100; E = Y × (1 − s); Target = E/w
The time remaining is the standard NPER solve for the number of years at which the portfolio plus contributions reaches the target:
P(1 + g)ⁿ + A × ((1 + g)ⁿ − 1)/g = Target
Step 1: Split income into saving and spending. $120,000 x 35% = $42,000 of annual saving $120,000 - $42,000 = $78,000 of annual spending
Step 2: Compute the passive income the portfolio already produces. $250,000 x 4% = $10,000 a year
Step 3: Divide it by spending to get the ratio. $10,000 / $78,000 = 0.128205 = 12.8%
Step 4: Compute the portfolio that would end the dependence. $78,000 / 4% = $1,950,000
Step 5: Measure the gap. $1,950,000 - $250,000 = $1,700,000 still to accumulate
Step 6: Solve for the years. Starting at $250,000, adding $42,000 a year at the end of each year, growing at 5%, the balance reaches $1,950,000 after 19.3 years.
Step 7: Restate the portfolio as a multiple of annual spending. $250,000 / $78,000 = 3.2x annual expenses already banked
Step 8: Measure what one year of saving buys. $42,000 / $78,000 x 12 = 6.5 months of spending, before any investment return. That is the crudest and in some ways the most honest way to read a savings rate: a year of work at 35% buys a bit over half a year of freedom.
Worked Example
The savings rate does two things at once, and the cleanest way to see it is to change only that input.
Step 1: Establish the baseline at 35%. Saving $42,000, spending $78,000, target $1,950,000, 19.3 years
Step 2: Raise the savings rate to 50%. Saving: $120,000 x 50% = $60,000 Spending: $120,000 - $60,000 = $60,000 Target: $60,000 / 4% = $1,500,000 Years: 12.7 years
Step 3: Decompose what happened. Contributions rose by $18,000 a year, and the target fell by $450,000. Fifteen percentage points of savings rate removed 6.6 years, and roughly half of that came from the target falling rather than from the contributions rising.
Step 4: Cut the savings rate to 20% instead. Saving $24,000, spending $96,000, target $2,400,000, and the timeline stretches to 28.1 years.
Step 5: Note the asymmetry against the withdrawal rate. Hold the savings rate at 35% and move only the withdrawal rate from 4% to 3.5%. The target rises to $2,228,571.43 and the timeline to 21.2 years, an increase of 1.9 years. A fifteen-point change in the savings rate moved the answer three and a half times as far as a half-point change in the withdrawal rate.
Step 6: Read the coverage ratio alongside it. At the more conservative 3.5% withdrawal rate, the same $250,000 portfolio covers 11.2% of spending rather than 12.8%. The portfolio did not change. The assumption about what it can safely pay you did.
What does this calculator not account for?
- Tax on withdrawals. The safe withdrawal rate is applied to the whole portfolio and no tax is deducted from what it produces. A portfolio held largely in pre-tax accounts supports less spending than this suggests.
- Sequence-of-returns risk. A single constant return is applied every year. Real markets deliver a sequence, and the order of good and bad years matters materially near the point of drawdown.
- Changing spending. Annual spending is held constant. Retirement spending is often not flat, and healthcare costs in particular rise late.
- Social Security, pensions, annuities or any other future income stream, none of which reduce the portfolio target here.
- Home equity. The input asks for investments that can produce income, and the home you live in is deliberately excluded, because it does not pay you.
- Contribution limits and account types. Saving is a single annual number with no distinction between a 401(k), an IRA and a taxable brokerage.
- Income growth. Take-home income is constant across the whole projection.
- Inflation, except through whatever real return you supply. If you enter a nominal return, you will get a nominal answer and a target that is understated in real terms.
- Any validity of the 4% rule itself, which is a backtest result over a specific historical period and market, not a law.
What mistakes do people make with this?
- Entering a nominal return and reading the answer as today's money. A 5% real return and an 8% nominal return produce very different timelines, and only one of them can be compared with a target denominated in today's spending.
- Including the house in the portfolio. It raises the ratio without raising the passive income, because you cannot spend it while living in it.
- Using gross income instead of take-home. The model splits the income you enter into saving and spending, so entering gross income overstates spending, overstates the target and overstates the timeline.
- Chasing the return instead of the rate. Half a point of extra return moves the answer far less than five points of extra savings rate, because the return only affects one side of the equation.
- Reading the coverage ratio as progress toward the target. They are different fractions. Coverage here is 12.8% while the portfolio is 12.8% of the target too, which happens only because both use the same withdrawal rate; the multiple of expenses banked, 3.2x, is a third way of saying it and reads quite differently.
- Treating 4% as safe by definition. Moving to 3.5% raises the target by $278,571.43 and adds nearly two years. That is the price of the caution, and it should be a decision rather than a default.
- Forgetting that spending after independence is what sets the target, not spending today. If you plan to spend more later, the target is higher than this page shows.
Frequently Asked Questions
What is a good financial independence ratio?
How is the FI number calculated?
Why does my savings rate matter more than my investment return?
Should I use a 4% or a 3.5% withdrawal rate?
Does this include Social Security?
What does "6.5 months of freedom per year saved" mean?
Sources
- Milevsky, M. A. and Robinson, C. (2005), "A Sustainable Spending Rate without Simulation," Financial Analysts Journal 61(6). doi.org/10.2469/faj.v61.n6.2776
- Board of Governors of the Federal Reserve System, Survey of Consumer Finances. federalreserve.gov/econres/scfindex.htm
This calculator uses no statutory data and no published tables. Every input is supplied by the user and the arithmetic is pure time-value-of-money mathematics, delegated to the shared NPER solver in engine/primitives/tvm.ts.
Also consulted: The 4% safe withdrawal rate that the default assumes is not an authority's figure. It originates in historical backtesting of US portfolios over thirty-year retirements, published in the 1990s, and it has been argued over ever since. Treat it as an assumption you are choosing, which is why it is an input rather than a constant; The expected return is likewise your assumption. There is no source for a future return, and any page that offers you one is offering you an opinion.