Quick Answer: The Piotroski F-Score grades a company's financial health from 0 to 9 by scoring nine binary year-over-year tests across profitability, leverage and liquidity, and operating efficiency, with higher scores indicating improving fundamental strength.
Overview
The Piotroski F-Score was introduced by Stanford accounting professor Joseph Piotroski in a 2000 paper published in the Journal of Accounting Research. Piotroski set out to test whether investors could improve the returns of a simple value strategy, buying stocks with low price-to-book ratios, by screening out the companies whose fundamentals were quietly deteriorating even though they looked statistically cheap. His answer was a nine-point checklist built entirely from figures already sitting in a company's financial statements: no forecasts, no subjective judgment calls, just year-over-year comparisons that either pass or fail.
Each of the nine criteria awards exactly one point when the company's financial statements show improvement, and zero points when they do not. The nine criteria split into three groups. Profitability, worth four points, checks whether the company is actually generating cash and profit, and whether its reported earnings are backed by real cash flow rather than accounting adjustments. Leverage, liquidity, and source of funds, worth three points, checks whether the company's balance sheet is getting stronger or weaker and whether it is raising cash by diluting existing shareholders. Operating efficiency, worth two points, checks whether the company is getting better at converting revenue into profit and at putting its assets to work. Sum the nine results and you get a score from 0 to 9. Piotroski's original research found that value stocks scoring 8 or 9 significantly outperformed the broader value universe over the following two years, while those scoring 0 or 1 badly underperformed and were disproportionately likely to face financial distress.
This calculator runs the full nine-point checklist from the underlying financial figures rather than asking you to pre-judge each criterion yourself. Enter current and prior-year net income, cash flow, leverage, liquidity, share count, margin, and turnover data, and it derives each of the nine pass/fail results and totals the score.
How This Is Calculated
Profitability (4 points). A point is awarded for each of the following that holds true in the current fiscal year: net income is positive; return on assets (net income divided by total assets) is positive; operating cash flow is positive; and operating cash flow exceeds net income, a quality-of-earnings check often called the accruals test, since cash flow persistently below reported earnings can signal aggressive revenue recognition or working-capital strain.
Leverage, Liquidity, and Source of Funds (3 points). A point is awarded for each of: a decrease in the long-term debt-to-total-assets ratio compared with the prior year; an increase in the current ratio (current assets divided by current liabilities) compared with the prior year; and the absence of new share issuance, meaning diluted shares outstanding did not increase year over year.
Operating Efficiency (2 points). A point is awarded for each of: an increase in gross margin (gross profit divided by revenue) compared with the prior year; and an increase in asset turnover (revenue divided by total assets) compared with the prior year.
This calculator computes return on assets and the current ratio using the platform's dedicated ratio primitives, and evaluates the remaining seven year-over-year comparisons directly from the raw figures you provide, using arbitrary-precision Decimal arithmetic throughout so the pass/fail boundary on each test is never blurred by floating-point rounding.
Worked Example
Consider a company with the following current and prior fiscal year figures:
| Metric | Current Year | Prior Year |
|---|---|---|
| Net Income | $5,000,000 | - |
| Total Assets | $50,000,000 | - |
| Operating Cash Flow | $6,000,000 | - |
| Long-Term Debt / Total Assets | 16% | 22% |
| Current Assets | $15,000,000 | $12,000,000 |
| Current Liabilities | $8,000,000 | $7,500,000 |
| Diluted Shares Outstanding | 105 million | 100 million |
| Gross Margin | 40% | 37% |
| Asset Turnover | 0.85x | 0.80x |
Score the nine tests one at a time. Each is binary, and nothing is weighted.
Step 1 -- Positive net income. $5,000,000 is greater than zero: Pass
Step 2 -- Positive return on assets. $5,000,000 / $50,000,000 = 10%, greater than zero: Pass
Step 3 -- Positive operating cash flow. $6,000,000 is greater than zero: Pass
Step 4 -- The accruals test, CFO above net income. $6,000,000 is greater than $5,000,000: Pass
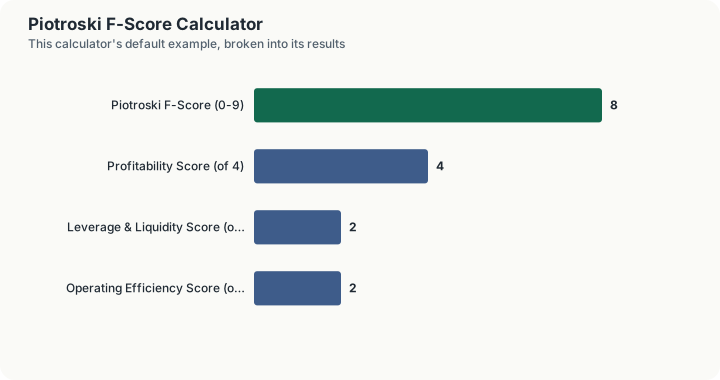
Step 5 -- Profitability subtotal. 1 + 1 + 1 + 1 = 4 of 4
Step 4 is the one that carries the most information. The other three are satisfied by any profitable company; this one asks whether the profit arrived as cash.
Step 6 -- Decreasing leverage. 16% against a prior 22%, so the ratio fell: Pass
Step 7 -- Current ratio, prior year. $12,000,000 / $7,500,000 = 1.60
Step 8 -- Current ratio, current year. $15,000,000 / $8,000,000 = 1.875
Step 9 -- Increasing current ratio. 1.875 is greater than 1.60: Pass
Step 10 -- No new shares issued. 105 million against a prior 100 million, so the count rose: Fail
Step 11 -- Leverage and liquidity subtotal. 1 + 1 + 0 = 2 of 3
Step 12 -- Increasing gross margin. 40% against a prior 37%: Pass
Step 13 -- Increasing asset turnover. 0.85x against a prior 0.80x: Pass
Step 14 -- Efficiency subtotal. 1 + 1 = 2 of 2
Step 15 -- The F-Score. 4 + 2 + 2 = 8 of 9
Step 16 -- The rating that produces. High Quality (7-9): improving financial strength across most criteria
The single failure is step 10, and it is worth reading carefully. The company paid down debt, improved liquidity, widened margins and used its assets harder, but funded some of that by issuing 5 million shares. Piotroski treats new equity as a negative signal on the view that a strengthening company should not need it, so a firm improving on eight fronts loses a point for how it financed the ninth.
The score is unweighted, which cuts both ways:
Step 17 -- Swap the two results: no dilution, but CFO of $4,000,000 instead of $6,000,000. Step 10 flips to Pass and step 4 flips to Fail, since $4,000,000 is below the $5,000,000 of net income
Step 18 -- The resulting score. Still 8 of 9, still rated High Quality, with profitability now 3 of 4
Two very different companies, one identical score. Reported earnings running $1,000,000 ahead of cash is a materially worse signal than a modest share issuance, but the F-Score is a count, not a weighting, and reading the nine-item breakdown matters more than reading the total.
What This Does Not Account For
The F-Score is a purely mechanical, backward-looking checklist and was originally validated specifically within a universe of low price-to-book value stocks, not as a standalone signal across the entire market. It does not evaluate valuation at all; a company can score a perfect 9 and still be expensive relative to its earnings or assets. It does not distinguish between the reasons behind share issuance, treating a dilutive equity raise used to fund a value-destroying acquisition the same as one used to fund genuinely profitable growth. It ignores qualitative factors entirely: management quality, competitive moat, industry structure, and regulatory risk play no role in the score. It is also sensitive to one-off accounting items and can be skewed by a single unusual year, since each criterion only compares two data points rather than a longer trend. Finally, it was built and tested on U.S. GAAP financial statements from a specific historical period, and its predictive power outside that context, across other accounting regimes, market regimes, or time periods, has not been established with the same rigor.
Common Pitfalls
- Using this score in isolation from valuation. Piotroski's original research paired the F-Score with a low price-to-book screen; a high F-Score on an already-expensive stock is a different signal than a high F-Score on a statistically cheap one.
- Comparing year-over-year figures that are not truly comparable. Restatements, accounting changes, mergers, or divestitures between the two years being compared can distort every criterion built on that data.
- Treating a single failed criterion as disqualifying. An F-Score of 8 out of 9 is still considered strong; look at which specific criterion failed and whether it reflects a meaningful concern (such as share dilution) or a benign, one-time event.
- Applying the score to financial companies without adjustment. Banks and insurers have fundamentally different balance sheet structures, and leverage in particular means something different for a financial institution than for an industrial company.
- Ignoring trend and using only a single year's snapshot. Running the F-Score across several consecutive years reveals whether a company's fundamentals are consistently improving or whether a single strong year is an outlier.
Frequently Asked Questions
What is considered a good Piotroski F-Score?
Does a high F-Score mean I should buy the stock?
Why does issuing new shares count against a company?
Can the F-Score be calculated for a company's first year of public filings?
How is the F-Score different from the Altman Z-Score?
Sources
- CFA Institute. Financial Statement Analysis: Applications, CFA Program Curriculum. cfainstitute.org
- U.S. Securities and Exchange Commission. Form 10-K reporting requirements for comparative financial statements. sec.gov
- Piotroski, J. D. (2000), "Value Investing: The Use of Historical Financial Statement Information to Separate Winners from Losers," Journal of Accounting Research. The nine-signal F-score. doi.org/10.2307/2672906
Also consulted: Piotroski, Joseph D. "Value Investing: The Use of Historical Financial Statement Information to Separate Winners from Losers." Journal of Accounting Research, Vol. 38, 2000; Financial Accounting Standards Board (FASB). ASC 230, Statement of Cash Flows.