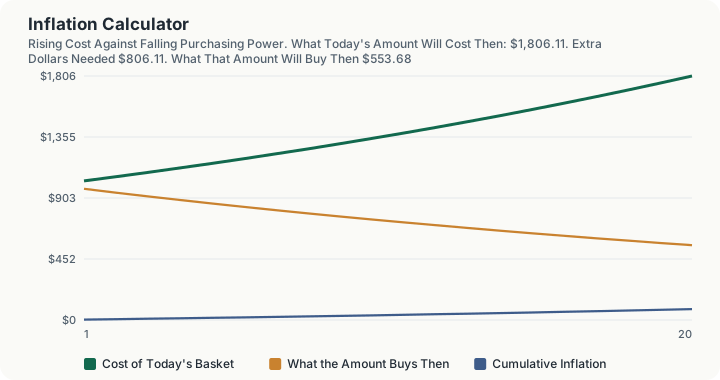
Quick Answer: At 3% inflation, something that costs $1,000 today will cost $1,806.11 in twenty years, and $1,000 held as cash for those twenty years will buy what $553.68 buys today. That is 44.63% of your purchasing power gone without a single dollar leaving your account. At 3%, money halves in value every 23.45 years.
What does this calculator do?
This is the general-purpose purchasing power tool. You supply an inflation rate you believe in and it answers the two questions that matter, in both directions: what a thing you buy today will cost later, and what a fixed sum of money will actually buy later.
It is deliberately forward looking and assumption driven. It does not read the Consumer Price Index. If you want a figure anchored to published CPI-U data between two past years, use the historical inflation calculator, which looks up the actual index. If you want to model your own spending creeping upward as your income rises, that is lifestyle inflation and has its own tool. This page is for the plain question: at some rate, over some number of years, what happens to money?
The two answers are reciprocals of each other and people routinely confuse them. Prices rising 80.61% over the period is the same event as purchasing power falling 44.63%. They are different numbers because a percentage increase and the corresponding percentage decrease are computed against different bases. Both are correct and both describe the same twenty years.
The calculator also applies the Fisher equation to the return you actually earn on the money, because inflation only matters relative to what your money is doing. Cash under a mattress loses 2.913% a year in real terms at 3% inflation. The same money at 7% nominal gains 3.883% a year in real terms.
How is this calculated?
Future cost = P × (1 + i)ⁿ; Purchasing power = P/((1 + i)ⁿ)
Real rate = (1 + r_nominal)/(1 + i) − 1; Halving time = ln 2/(ln(1 + i))
The engine performs these steps:
Step 1: Convert the inflation rate to a decimal and add one. $1 + (3 \div 100) = 1.03$
Step 2: Raise that to the power of the number of years. $1.03^{20} = 1.80611123$
Step 3: Multiply the amount by that factor for the future cost. $1,000 \times 1.80611123 = \$1,806.11$
Step 4: Subtract the original amount to isolate the increase. $1,806.11 - 1,000 = \$806.11$
Step 5: Divide the amount by the same factor for purchasing power. $1,000 \div 1.80611123 = \$553.68$
Step 6: Subtract that from the amount to get purchasing power lost. $1,000 - 553.68 = \$446.32$, which is $446.32 \div 1,000 = 44.63\%$
Step 7: Apply the Fisher equation to your nominal return. (1 + 0.00) ÷ (1 + 0.03) − 1 = −2.913% per year in real terms
Step 8: Grow the money at the nominal return, then discount it back. At 0% the balance stays at $1,000.00, and dividing by 1.80611123 gives $553.68 in today's money.
Step 9: Solve for the halving time. ln 2 ÷ ln(1.03) = 0.69314718 ÷ 0.02955880 = 23.45 years
Every row of the table repeats steps 2 through 6 at that year.
Worked Example
Take $1,000 and 3% inflation over twenty years.
- Inflation factor: $1.03^{20}$ = 1.80611123
- What today's $1,000 basket costs then: $1,806.11
- Extra dollars required: $806.11
- What $1,000 of cash buys then: $553.68
- Purchasing power destroyed: $446.32, or 44.63%
Now invest the same $1,000 at 7% nominal. The balance grows to $1,000 x 1.07^20 = $3,869.68. Discounting that back through the same 1.80611123 factor gives $2,142.55 in today's money. The real gain is a little over double, not the near quadrupling the nominal figure suggests. The Fisher real rate is 3.883% a year, which is not 7% minus 3%.
Raise inflation to 6%. The $1,000 basket now costs $3,207.14 after twenty years, and purchasing power halves in 11.9 years rather than 23.45. Doubling the inflation rate roughly halves the halving time, which is why the difference between a 2% and a 4% regime compounds into something enormous over a working life.
Carrying The Basket Forward, Year By Year
Step 1: Year one. The $1,000 basket costs $1,030.00, the $1,000 of cash buys $970.87, and cumulative inflation is 3.00%
Step 2: Year two. Cost $1,060.90, purchasing power $942.60, cumulative inflation 6.09% rather than 6.00%. The nine basis points are the compounding.
Step 3: Year ten, the halfway mark. Cost $1,343.92, purchasing power $744.09, cumulative inflation 34.39%
Step 4: Year twenty. Cost $1,806.11, purchasing power $553.68, cumulative inflation 80.61%
The first decade takes 25.6 cents of the dollar and the second takes a further 19.0 cents, which is the point people get backwards. Inflation feels like it is slowing because each later year removes a smaller absolute slice of what is left, while the cost of the basket is accelerating in dollar terms the whole way.
What does this calculator not account for?
- Actual published inflation. The rate is an assumption you enter. Nothing here is anchored to CPI-U, PCE, or any official index, and a constant rate is a simplification of what is in reality a volatile series.
- Your personal inflation rate. Headline CPI is a weighted national basket. If your spending is dominated by rent, childcare, insurance or medical care, your lived rate may be well above it for years at a time.
- Taxes. Nominal returns are taxed on the nominal gain, including the part that is purely inflation. The real after-tax return is lower than the real pre-tax figure shown here.
- Quality change and substitution. Statistical agencies adjust for both. A constant-rate model does not.
- Currency effects. Imported goods respond to the exchange rate as well as to domestic inflation.
- Wages and benefits. Salary increases and cost-of-living adjustments are not modelled.
- Deflation. A negative rate is accepted, but sustained deflation changes borrower and lender behaviour in ways no arithmetic here captures.
What mistakes do people make with this?
- Subtracting inflation from your return. 7% minus 3% is 4%, but the correct real rate is 3.883%. The approximation gets worse as both rates rise, and it is meaningfully wrong at double-digit inflation.
- Treating the two percentages as contradictory. An 80.61% price rise and a 44.63% loss of purchasing power are the same fact viewed from either end.
- Assuming a low rate is harmless. Even 2% costs about a third of purchasing power over twenty years.
- Projecting the last twelve months forward for decades. Recent inflation is a poor predictor of the long run in either direction.
- Ignoring the tax drag on inflationary gains. You pay tax on nominal gains, so a nominal return that merely matches inflation leaves you behind after tax.
- Forgetting that the years matter more than the rate. A modest rate over forty years does more damage than an alarming rate over five.
- Using this for a past period. For a backward-looking figure between two actual years, the historical inflation calculator uses the published index instead of an assumption.
Frequently Asked Questions
What inflation rate should I use?
Why is my real return not just the difference between the two rates?
How long until my money is worth half as much?
Does this use real CPI data?
Why does the price rise percentage exceed the purchasing power loss percentage?
Does inflation help me if I have debt?
Sources
- Board of Governors of the Federal Reserve System, the official authority for the inflation this calculator relates to. federalreserve.gov
There is no statutory source for these formulas and none is invented here. The compounding relation P(1 + i)ⁿ, its reciprocal for purchasing power, and the Fisher equation relating nominal and real rates are standard results in financial mathematics. Irving Fisher set out the nominal, real and inflation relationship in The Theory of Interest (1930); the exact multiplicative form used here is the one economists use, not the linear approximation.
The implementations live in engine/primitives/inflation.ts and are proven against hand-derived vectors in engine/vectors/inflation.test.ts. The halving-time result solves (1 + i)ⁿ = 2 for $n$ algebraically.
For published price index data rather than an assumed rate, the primary sources are the US Bureau of Labor Statistics for CPI-U and the Bureau of Economic Analysis for the PCE price index. This page does not query either; the historical inflation calculator on this site uses the BLS annual-average CPI-U series.