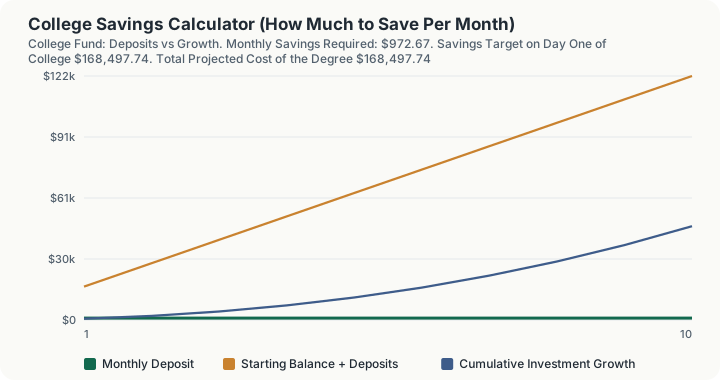
Quick Answer: To cover four years at a school costing $24,000 a year today, starting 10 years out with $5,000 already saved and earning 6%, you need to deposit $972.67 a month. Cost inflation of 5% pushes the first year's bill to $39,093.47 and the four-year total to $168,497.74.
What does this calculator do?
There are two ways to model a college fund, and they answer opposite questions. One takes a contribution you have already decided on and projects what it becomes. The other starts from the bill and works backwards to the deposit required to pay it. This calculator does the second, which is the one families actually need before they can decide anything.
The reason the backwards version matters is cost inflation. Published cost of attendance has historically risen faster than general consumer prices, and the effect compounds twice over: once between now and matriculation, and again across the years the student is enrolled. A school that costs $24,000 a year today does not cost $96,000 for a four-year degree that begins in a decade. It costs $168,498, because the first year alone has grown to $39,093 and the fourth year to $45,256.
This page is deliberately account-agnostic. It does not care whether the money sits in a 529 plan, a Coverdell ESA, a UTMA, or a plain brokerage account, so it applies no contribution cap and no gift tax rule. The 529 and Coverdell pages handle those account-specific mechanics. What this page gives you is the number that comes first: how much, per month, starting now.
How is this calculated?
- Inflate today's cost to the matriculation year. The annual cost of attendance you enter is multiplied by (1 + cost inflation) raised to the number of years until enrolment. At 5% over 10 years the factor is 1.628895.
- Compute the first-year bill. Today's cost times that factor gives the cost of year one of enrolment.
- Inflate each subsequent year of enrolment. Costs do not freeze on the day the student arrives. Year two costs the first-year figure times (1 + inflation), year three times (1 + inflation) squared, and so on, so the tool computes each year separately.
- Sum the years. Adding every year of enrolment gives the total projected cost of the degree.
- Apply the share you intend to fund. Multiply the total by your chosen coverage percentage. Funding 100% makes the savings target equal the total cost.
- Grow what you already have. Your existing balance compounds at the expected return over the same horizon, at the monthly periodic rate. This reduces what the deposits must supply.
- Find the gap. Savings target minus the future value of the existing balance is the amount the new deposits must produce.
- Divide by the annuity accumulation factor. The shared sinking-fund primitive solves for the level monthly deposit that accumulates to that gap, using the standard payment solve. This is the required monthly savings.
The accumulation factor in step 8 is:
s_n|i = ((1 + i)ⁿ − 1)/i
where $i$ is the monthly periodic rate and $n$ is the number of months. The required deposit is the funding gap divided by that factor.
Worked Example
Use the default inputs: a school costing $24,000 a year today, 10 years until enrolment, four years of study, 5% cost inflation, $5,000 already saved, a 6% expected return, and full coverage.
Step 1. Cost inflation factor: 1.05 raised to the 10th equals 1.628895.
Step 2. First-year cost: $24,000 times 1.628895 equals $39,093.47.
Step 3. Second year: $39,093.47 times 1.05 equals $41,048.14.
Step 4. Third year: $39,093.47 times 1.1025 equals $43,100.55.
Step 5. Fourth year: $39,093.47 times 1.157625 equals $45,255.58.
Step 6. Total projected cost: $39,093.47 plus $41,048.14 plus $43,100.55 plus $45,255.58 equals $168,497.74.
Step 7. Savings target at 100% coverage: $168,497.74.
Step 8. Monthly periodic rate: 6% divided by 12 equals 0.005.
Step 9. Growth factor over 120 months: 1.005 raised to the 120th equals 1.819397.
Step 10. Existing savings grow to $5,000 times 1.819397, or $9,096.98.
Step 11. Funding gap: $168,497.74 minus $9,096.98 equals $159,400.76.
Step 12. Annuity accumulation factor: (1.819397 minus 1) divided by 0.005 equals 163.879347.
Step 13. Required monthly deposit: $159,400.76 divided by 163.879347 equals $972.67.
Compare that against saving in cash. With no return at all, the same target would need ($168,497.74 minus $5,000) divided by 120 months, or $1,362.48 a month. Investing at 6% cuts the required deposit by $389.81 every month.
Now change the coverage. Funding half the bill instead of all of it drops the target to $84,248.87 and the deposit to $458.58 a month, which is more than half the original because the existing $5,000 covers a larger share of the smaller target.
What does this calculator not account for?
- Financial aid, grants, and scholarships. The model funds the published sticker price. Most families pay considerably less than sticker after institutional aid, which is why the coverage percentage input exists. Use the financial aid calculator to estimate need-based awards.
- Tax treatment of the account. No tax is applied to the growth. That is correct for a 529 or Coverdell used on qualified expenses, and wrong for a taxable brokerage account, where annual dividends and realized gains create a drag this model does not subtract.
- Contribution limits and gift tax. No cap of any kind is imposed. A Coverdell ESA is limited to $2,000 per beneficiary per year, and 529 contributions above the annual gift tax exclusion have filing consequences. Neither is modeled here.
- Sequence of returns. A single fixed return is applied every month. A market decline in the year before matriculation, when the fund is at its largest and has no time to recover, damages a college fund far more than the average return suggests.
No published authority forecasts future college cost inflation or future investment returns. Both are your assumptions. Historical published cost-of-attendance data from the National Center for Education Statistics is the right starting point for the first, but it is history, not a forecast, and this page does not present it as one.
What mistakes do people make with this?
- Multiplying today's cost by the number of years. Four times $24,000 is $96,000. The real projected figure is $168,498, a 76% understatement. This is by far the most common error.
- Forgetting that costs rise during enrolment too. Even families who correctly inflate the first year often treat years two through four as costing the same. In the default case that alone misses $18,000.
- Delaying the start. The required deposit is not linear in time. Starting five years earlier gives the fund 180 months of compounding instead of 120 and cuts the monthly figure substantially, which the built-in scenario demonstrates.
- Funding 100% by reflex. Many families deliberately fund a share and expect scholarships, student earnings, or modest borrowing to close the rest. Setting the coverage input honestly produces a target you will actually hit.
- Confusing this with a 529 projection. The 529 calculator answers "what does my $300 a month become?" This one answers "what must my monthly deposit be?" They are inverses, and running one when you needed the other gives a plausible-looking number to the wrong question.
Frequently Asked Questions
How much should I save per month for college?
Why is the total cost so much higher than four times today's price?
Does it matter which account I use?
What if I am already ahead of the target?
Sources
- National Center for Education Statistics, Digest of Education Statistics, tables on average undergraduate tuition, fees, room and board, the primary published source for the current cost of attendance figure this calculator asks you to supply: nces.ed.gov/programs/digest
- Internal Revenue Code Section 529 and IRS Publication 970, "Tax Benefits for Education," for the federal treatment of qualified education savings accounts referenced in the limitations above: irs.gov/publications/p970
Also consulted: The college cost inflation rate and the expected investment return are user assumptions. No government agency, regulator, or standards body publishes a forward-looking figure for either, and none is asserted here.