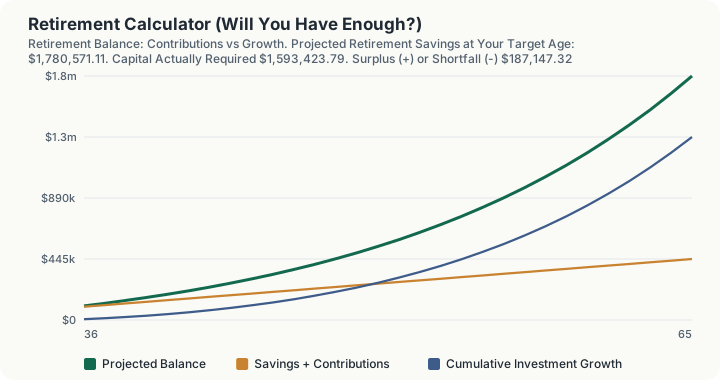
Quick Answer: A 35-year-old with $85,000 already saved who adds $12,000 a year and earns 7% is projected to reach $1,780,571.11 by age 65. Against a $60,000-a-year retirement income target (in present-day dollars), $24,000 of expected Social Security, 2.5% inflation, a 5% return in retirement and a 30-year horizon, the capital actually required is about $1,593,424, leaving a surplus of roughly $187,147.
What does this calculator do?
Most retirement tools answer only half the question. They project a balance and stop, leaving you to guess whether the number that appears is large or small. A projected $1.8 million means nothing on its own: it is comfortable for a household that wants $60,000 a year and collects Social Security, and it is thin for a household that wants $120,000 a year and collects nothing.
This calculator answers the whole question. It does two independent calculations and then compares them. The first is an accumulation projection: what your existing savings and future contributions grow to by your target retirement age. The second is a capital requirement: how large a portfolio must be, on the day you retire, to fund the spending you actually want for as long as you actually need it, after Social Security covers its share. The output that matters is the difference between the two.
It is deliberately account-agnostic. A 401(k) calculator models one plan with its own deferral limit and employer match. A Roth IRA calculator models one account with its own contribution cap. This tool takes the combined balance of everything you hold for retirement and the combined amount you add each year, because the adequacy question is a household question, not an account question.
How is this calculated?
- Count the working years. Target retirement age minus current age, floored at one year. In the default case, 65 minus 35 gives 30 years.
- Grow the existing savings. Your current balance compounds at the pre-retirement return for those years. At 7%, the growth factor is 1.07 raised to the 30th power, or 7.612255.
- Grow the contributions. Annual contributions are treated as an ordinary annuity, deposited at the end of each year, and accumulated by the same shared time-value function. The factor is (1.07 to the 30th, minus 1) divided by 0.07, or 94.460786.
- Add the two. Starting savings times its growth factor, plus annual contribution times the annuity factor, gives the projected balance.
- Inflate the income target. Your desired annual income is entered in today's dollars, so it is multiplied by (1 + inflation) raised to the working years to restate it in the nominal dollars of your first retirement year. At 2.5% over 30 years the factor is 2.097568.
- Inflate Social Security the same way. Your expected benefit is also entered in today's dollars and is inflated by the identical factor, so the two figures stay comparable.
- Find what the portfolio itself must supply. Inflated income target minus inflated Social Security, floored at zero. This is the first-year portfolio withdrawal.
- Convert the nominal return to a real return. Because the withdrawal grows with inflation every year of retirement, the correct discount rate is the real return, computed by the exact Fisher relation: (1 + nominal) divided by (1 + inflation), minus 1. At 5% nominal and 2.5% inflation this is 2.44%.
- Discount the withdrawal stream. The required capital is the present value of a level real annuity of the first-year withdrawal, over the number of retirement years, at the real return.
- Subtract. Projected balance minus required capital is the surplus or shortfall. When it is negative, the tool also divides the gap by the same annuity factor from step 3 to report the extra annual contribution that would close it.
The capital requirement in steps 8 and 9 is:
C = W × (1 − (1 + r_real)⁻ⁿ)/r_real
where $W$ is the first-year portfolio withdrawal, r_real is the Fisher real return, and $n$ is the number of retirement years.
Worked Example
Take the default inputs: age 35, retiring at 65, $85,000 saved, $12,000 contributed annually, 7% return while working, a $60,000 income target, $24,000 of Social Security, 2.5% inflation, 5% return in retirement, and 30 years to fund.
Step 1. Working years: 65 minus 35 equals 30.
Step 2. Growth factor on existing savings: 1.07 to the 30th equals 7.612255.
Step 3. Existing savings grow to $85,000 times 7.612255, or $647,041.68.
Step 4. Annuity factor: (7.612255 minus 1) divided by 0.07 equals 94.460786.
Step 5. Contributions grow to $12,000 times 94.460786, or $1,133,529.44.
Step 6. Projected balance: $647,041.68 plus $1,133,529.44 equals $1,780,571.11.
Step 7. Inflation factor: 1.025 to the 30th equals 2.097568.
Step 8. Income target in year one of retirement: $60,000 times 2.097568 equals $125,854.05.
Step 9. Social Security in year one: $24,000 times 2.097568 equals $50,341.62.
Step 10. First-year portfolio withdrawal: $125,854.05 minus $50,341.62 equals $75,512.43.
Step 11. Real return: 1.05 divided by 1.025, minus 1, equals 0.0243902, or 2.44%.
Step 12. Annuity discount factor over 30 years at 2.44%: 21.101477.
Step 13. Required capital: $75,512.43 times 21.101477 equals $1,593,423.81.
Step 14. Surplus: $1,780,571.11 minus $1,593,423.81 equals $187,147.30, which funds 111.7% of the target.
Now change one input. Cut the annual contribution from $12,000 to $4,000 and the projected balance falls to $1,024,884.82, turning the surplus into a $568,538.99 shortfall. Closing that gap by age 65 would require an extra $6,018.78 every year.
Carrying the Accumulation Forward
Step 15: End of year one, age 36. Balance $102,950.00, of which $97,000.00 is starting savings plus contributions and $5,950.00 is growth.
Step 16: End of year two, age 37. Balance $122,156.50. Contributions to date $109,000.00, cumulative growth $13,156.50, meaning year two alone produced $7,206.50 of growth against a $12,000 contribution.
Step 17: Age 41, where growth overtakes saving. The portfolio earns $13,175.80 in that year against the $12,000 contributed, on a balance of $213,401.57. From this point the market is the larger contributor, every year, for the remaining 24 years.
Step 18: Age 65. Balance $1,780,571.11: $445,000.00 of savings and contributions and $1,335,571.11 of growth.
Three quarters of the final balance is growth, and the crossover that makes it possible arrives at age 41: six years in, on a balance still under a quarter of a million. Delaying the start by those six years does not cost six years of contributions, it costs the twenty-four years of compounding that sit on top of them.
What does this calculator not account for?
- Taxes on withdrawals. The projection treats the whole balance as spendable. Money in a traditional 401(k) or IRA is taxed as ordinary income when withdrawn, so a pre-tax balance funds less spending than the same balance held in a Roth. This tool draws no distinction between account types.
- Sequence-of-returns risk. A single fixed return is applied every year. In reality a poor first decade of retirement damages a portfolio far more than the same poor decade later, and no average return captures that. The Monte Carlo retirement calculator models this dispersion directly.
- Social Security uncertainty. Your entered benefit is inflated at your general inflation assumption, not at the SSA's wage-indexing and COLA formulas, and no adjustment is made for claiming age or for any future change in benefit law.
- Healthcare and long-term care. Medicare premiums, IRMAA surcharges, and long-term care costs have historically risen faster than general inflation and are not separated out.
None of the three rate assumptions comes from a published authority. No government agency or regulator publishes an expected market return, a long-run inflation forecast for personal planning, or a correct retirement horizon. They are your assumptions, and the result is only as good as they are.
What mistakes do people make with this?
- Mixing today's dollars with future dollars. The income target and Social Security fields both take today's dollars, and the tool inflates them for you. Entering an already-inflated figure double counts inflation and badly overstates what you need.
- Discounting the retirement withdrawals at the nominal return. If the withdrawal grows with inflation, discounting it at 5% rather than the 2.44% real rate understates the required capital by a wide margin. This is the single most common error in do-it-yourself retirement spreadsheets.
- Treating the surplus as spare cash. A surplus is the buffer against every item in the section above, particularly taxes and sequence risk. Funding 111.7% of a target is not the same as being 11.7% overfunded in practice.
- Assuming the pre-retirement return continues in retirement. Most households de-risk as they approach retirement, which is why this tool takes two separate return inputs. Leaving both at 7% quietly assumes an equity-heavy portfolio for a further 30 years.
Frequently Asked Questions
How much do I actually need to retire?
Why does the tool inflate Social Security as well as my spending?
How is this different from a 401(k) or FIRE calculator?
What return should I assume?
Sources
- Internal Revenue Service, Revenue Procedure 2025-32 (Internal Revenue Bulletin 2025-45), for the 2026 inflation-adjusted federal figures held in this project's verified tax tables: irs.gov/pub/irs-drop/rp-25-32.pdf
- Social Security Administration, "2026 Social Security Changes" fact sheet, for cost-of-living adjustment and wage base data: ssa.gov/news/press/factsheets/colafacts2026.pdf
- Social Security Administration, "Your Social Security Statement," the primary source for the benefit estimate this calculator asks you to supply: ssa.gov/myaccount
Also consulted: The expected return, inflation, and retirement-horizon assumptions are user inputs. No government agency, regulator, or standards body publishes an official figure for any of the three, and none is asserted here.