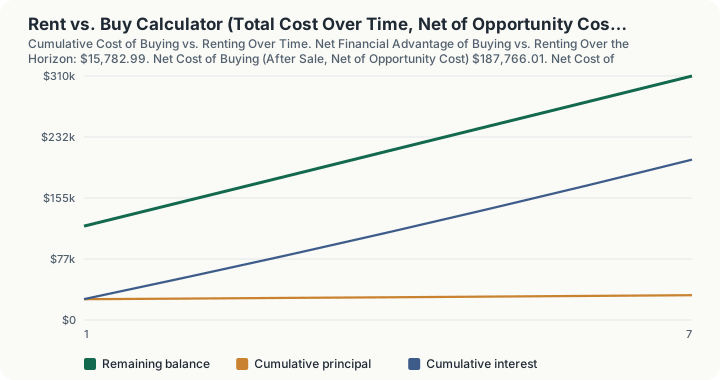
Quick Answer: On a $380,000.00 home at 20% down, a 6.5% 30-year mortgage, national-average property tax and a $2,200.00 comparable rent, buying comes out $15,782.99 ahead of renting over a 7-year horizon once equity buildup and appreciation are counted: $187,766.01 net cost of buying against $203,549.00 of rent and renters insurance. At shorter horizons closing and selling costs can flip the direction entirely.
Overview
The rent-versus-buy question is usually asked as if it has a permanent answer: which one is "better." It doesn't. The answer depends almost entirely on how long you'll stay, because buying carries large upfront and back-end transaction costs (closing costs going in, agent commission coming out) that renting doesn't, and those costs only get diluted over time as you build equity and the home appreciates.
This calculator runs the full comparison: monthly cost of owning (principal, interest, property tax, maintenance, insurance) against monthly cost of renting (rent plus renters insurance, with rent growing annually), then nets out what you'd actually walk away with if you sold the home at your chosen horizon, minus what your down payment and closing costs would have earned if invested in the market instead of tied up in home equity. That last piece, the opportunity cost of the down payment, is the step most back-of-envelope rent-vs-buy comparisons skip, and it can be large: a $76,000 down payment invested at a real market return compounds meaningfully over a 5-to-10-year horizon.
How This Is Calculated
Buying, total cash outflow over the horizon:
Buying, net proceeds if sold at the horizon:
Buying, opportunity cost of the down payment (what it would have earned if invested instead, solved with the platform's TVM future-value function):
Net cost of buying:
Renting, total cost over the horizon (rent compounding annually at the assumed growth rate):
Comparison:
A positive result means buying is cheaper over that horizon; negative means renting is cheaper.
Worked Example: Why Horizon Changes the Answer
A $380,000 home at 20% down and 6.5% over thirty years, against $2,200 a month in rent. Every input below is the calculator's own default; only the horizon changes.
Step 1 -- The down payment. $380,000 x 20% = $76,000.00
Step 2 -- The closing costs. $380,000 x 3% = $11,400.00
Step 3 -- Total cash through the door on day one. $76,000.00 + $11,400.00 = $87,400.00
Step 4 -- Monthly principal and interest. $304,000 amortised at 6.5% over 360 months = $1,921.49
Step 5 -- The rest of the monthly carry. Property tax $281.83 + maintenance $316.67 + insurance $125.00 = $723.50
Step 6 -- Total monthly cost of owning. $1,921.49 + $723.50 = $2,644.99, against $2,200.00 of rent
Step 6 already shows why the monthly comparison is useless on its own. Owning costs $444.99 more a month, and part of that money is being handed back in equity while the rest is not.
Take the seven-year horizon first.
Step 7 -- Cash out over seven years. $87,400.00 upfront + $161,405.16 of P&I + $23,673.72 of tax + $26,600.28 of maintenance + $10,500.00 of insurance = $309,579.16
Step 8 -- What the home is worth at year seven. $380,000 x 1.035^7 = $483,466.12
Step 9 -- What is still owed. $274,865.04 of loan balance after 84 payments
Step 10 -- Net sale proceeds. ($483,466.12 x 93%) - $274,865.04 = $174,758.45
Step 11 -- The opportunity cost of the $87,400. $87,400 x 1.07^7 - $87,400 = $52,945.30 of investment return given up
Step 12 -- Net cost of buying. $309,579.16 - $174,758.45 + $52,945.30 = $187,766.01
Step 13 -- Net cost of renting the same seven years. $202,289.00 of rent (growing 3% a year) + $1,260.00 of renters insurance = $203,549.00
Step 14 -- The advantage. $203,549.00 - $187,766.01 = $15,782.99 in favour of buying
Now run the identical inputs over a shorter stay.
Step 15 -- Three years, net cost of buying. Cash out $182,619.64, net sale proceeds $98,712.58, opportunity cost $19,668.76, giving $103,575.82
Step 16 -- Three years, net cost of renting. $81,599.76 + $540.00 = $82,139.76
Step 17 -- The advantage at three years. $82,139.76 - $103,575.82 = -$21,436.06, so renting wins by more than twenty-one thousand dollars
Step 18 -- The swing between the two horizons. $15,782.99 - (-$21,436.06) = $37,218.82 of movement from four additional years, on identical assumptions about the house, the loan and the market
Nothing in step 18 is about the housing market being different. The $11,400 of closing costs and the 7% selling cost are fixed dollar amounts that four more years of equity and appreciation get to spread across and outrun.
Extend it further and the effect compounds:
Step 19 -- Fifteen years, net cost of buying. Net sale proceeds reach $371,489.47 on a home worth $636,632.56, and after an opportunity cost of $153,739.36 the net cost is $345,748.09
Step 20 -- Fifteen years, net cost of renting. $491,011.33 + $2,700.00 = $493,711.33
Step 21 -- The advantage at fifteen years. $493,711.33 - $345,748.09 = $147,963.24 in favour of buying
Note step 19 carefully. The opportunity cost has grown to $153,739.36, larger than the original down payment and closing costs combined, and buying still wins comfortably. Rent compounding at 3% a year is the reason: by year fifteen the renter is paying far more than $2,200 a month while the owner's principal and interest has not moved since step 4.
Why the Opportunity Cost of the Down Payment Matters
A down payment isn't free money you're "saving" by putting it into a house; it's capital that stops earning a market return the moment it becomes home equity instead. If that $69,000 down payment plus closing costs would otherwise sit in a diversified investment account earning something like 7% a year, ten years of that foregone growth is a real cost of buying, even though no check is ever written for it. This calculator's opportunity-cost term is what makes the comparison apples-to-apples with renting, where that same capital could stay invested the whole time.
What This Does Not Account For
- Mortgage interest and property tax deductibility. For itemizing filers, a portion of mortgage interest and property tax may be deductible, improving buying's after-tax economics; this calculator works in pre-tax dollars.
- PMI for down payments under 20%. Private mortgage insurance is not modeled; a smaller down payment than 20% will understate buying's true monthly cost.
- Rent control, lease renewal risk, or landlord-initiated non-renewal. Renting assumes you can find comparable housing at the modeled rent growth rate for the full horizon, which isn't guaranteed in every market.
- Refinancing. The mortgage rate and term are held fixed for the full horizon; a future refinance at a lower rate isn't modeled.
- Reassessment of property tax. Property tax is calculated on the original purchase price throughout, not on the appreciated value, which understates the real trajectory in many jurisdictions that reassess periodically.
- Lifestyle and non-financial factors. Stability, control over the property, and neighborhood permanence carry real value for many households that a pure cost comparison doesn't capture.
Common Pitfalls
- Comparing monthly payment to monthly rent directly, ignoring the horizon. A lower monthly payment than rent doesn't mean buying wins; the upfront and back-end transaction costs can outweigh years of modest monthly savings if you don't stay long enough.
- Ignoring the opportunity cost of the down payment entirely. This is the single most commonly skipped factor in casual rent-vs-buy comparisons, and it can be tens of thousands of dollars over a multi-year horizon.
- Assuming home appreciation is guaranteed. Historical average appreciation is a reasonable planning assumption, not a promise; a market downturn during your specific horizon changes the comparison substantially.
- Underestimating maintenance costs. The 1% of home value per year rule of thumb is a reasonable average, but older homes, larger homes, and homes with major systems (roof, HVAC) nearing end-of-life can run well above that.
- Using a horizon shorter than you actually expect to stay, "just to be conservative." This systematically biases the comparison toward renting, since transaction costs dominate short horizons; use your honestly-expected time horizon, not an artificially short one.
Frequently Asked Questions
How long do I need to stay in a home for buying to make sense?
Why does the calculator subtract an "opportunity cost" from buying?
Does this calculator include PMI?
What appreciation rate should I use?
Is a higher investment-return assumption always going to favor renting?
Sources
- S&P CoreLogic Case-Shiller Home Price Indices and Federal Housing Finance Agency House Price Index, for long-run home appreciation benchmarks. fhfa.gov
- Consumer Financial Protection Bureau: guidance on closing costs and the true cost of homeownership beyond principal and interest. consumerfinance.gov
- Himmelberg, C., Mayer, C. and Sinai, T. (2005), "Assessing High House Prices: Bubbles, Fundamentals and Misperceptions," Journal of Economic Perspectives 19(4), the annual cost of owning versus renting. doi.org/10.1257/089533005775196769
- Consumer Financial Protection Bureau, Buying a house. consumerfinance.gov/owning-a-home
Also consulted: National Association of Realtors: Profile of Home Buyers and Sellers, median homeowner tenure data; Freddie Mac: Primary Mortgage Market Survey, historical 30-year fixed mortgage rate data.