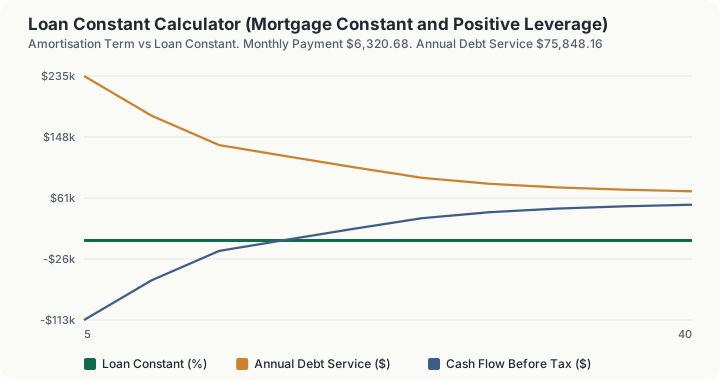
Quick Answer: A $1,000,000 loan at 6.5% amortised over 30 years carries a loan constant of 7.584816%: $75,848.16 of annual debt service on a $6,320.68 monthly payment. Against a $1,428,571 property producing $121,429 of net operating income, the cap rate is 8.50003255%, exceeding the constant by 0.91521655 points, so leverage is positive and cash-on-cash of 10.6355399689% beats the 8.50003255% unlevered return.
What does this calculator do?
The interest rate tells you what borrowed money costs. It does not tell you what borrowed money takes out of the property every year, because it ignores principal. The loan constant does:
Rₘ = (annual debt service)/(original loan amount)
That single ratio is why commercial underwriters use it and residential borrowers have never heard of it. An income property has to service the whole payment out of net operating income, not just the interest portion, so the number that has to be covered is the constant, not the rate.
Two consequences follow immediately.
An interest-only note has a constant exactly equal to its rate. Every amortising loan has a constant strictly above its rate. The gap between them is the amortisation premium, and it is not a cost: it is forced saving that comes back as equity.
The constant is the break-even cap rate for the debt. Compare them directly. If the property yields more per dollar than the debt takes per dollar, borrowing raises the return on equity. If it yields less, borrowing lowers it, and borrowing more makes it worse rather than better. That comparison is the leverage test, and it is the reason this page exists.
How is this calculated?
PMT = P × i/(1 − (1 + i)⁻ⁿ); Rₘ = (12 × PMT)/P
with $i$ the monthly rate and $n$ the number of monthly payments.
Step 1: Find the monthly rate. 6.5% / 12 = 0.5416667% per month
Step 2: Size the monthly payment on a 360-month schedule. $1,000,000 at 0.5416667% for 360 months = $6,320.68
Step 3: Annualise it. $6,320.68 x 12 = $75,848.16 of annual debt service
Step 4: Divide by the original loan amount. $75,848.16 / $1,000,000 = 7.584816%, the loan constant
Step 5: Compare against the interest-only constant, which is the rate itself. 6.5%
Step 6: The difference is the amortisation premium. 7.584816% - 6.5% = 1.084816 percentage points
Step 7: Express that premium in dollars, from the schedule rather than the ratio. Annual debt service less the first twelve months of interest = $11,177.25 of principal repaid in year one
Step 8: Compute the cap rate on the property. $121,429 / $1,428,571 = 8.50003255%
Step 9: Take the leverage spread. 8.50003255% - 7.584816% = 0.91521655 percentage points, so leverage is positive
Step 10: Find the equity invested. $1,428,571 - $1,000,000 = $428,571
Step 11: Find cash flow before tax. $121,429 - $75,848.16 = $45,580.84
Step 12: Cash-on-cash return on that equity. $45,580.84 / $428,571 = 10.6355399689%
Step 13: Compare against the unlevered return, which is the cap rate. 10.6355399689% against 8.50003255%, so borrowing added 2.135 points of return on equity
Step 14: Debt service coverage. $121,429 / $75,848.16 = 1.6
The break-even cap rate the engine reports is numerically the constant, 7.584816%, because that is precisely the yield at which cash-on-cash and the unlevered return coincide.
Worked Example
The most common way an investor destroys return is by shortening the amortisation, because a shorter schedule feels prudent and looks free. It is not free.
Step 1: Halve the schedule to 15 years at the same 6.5%. $1,000,000 over 180 months at 0.5416667% = $8,711.07 a month
Step 2: Annualise. $8,711.07 x 12 = $104,532.84 of annual debt service
Step 3: The constant. $104,532.84 / $1,000,000 = 10.453284%
Step 4: Compare against the same cap rate. 8.50003255% is now well below the constant, so leverage has turned negative
Step 5: And cash flow. $121,429 - $104,532.84 = $16,896.16, against $45,580.84 on the thirty-year schedule
Nothing about the property changed. Nothing about the rate changed. The identical asset went from positive to negative leverage purely because the debt now demands 10.45 cents per borrowed dollar per year while the property yields 8.50.
The reverse case is just as instructive. At a 4.5% rate over the same 30 years the constant falls to 6.08022%, widening the spread against an unchanged 8.50% cap rate and lifting cash-on-cash sharply. The table on this page runs the constant across amortisation terms from 5 to 40 years at your rate, so the whole curve is visible rather than one point on it.
One thing to be careful about in step 3: a 10.453284% constant does not mean you are losing money. Cash flow before tax is still positive at $16,896.16, and first-year principal repayment rises from $11,177.25 to $40,732.12, which goes into equity, not into the lender's pocket. Negative leverage means borrowing lowers your return on equity below what an all-cash purchase would earn. Whether that trade is acceptable depends on whether you want yield or amortisation, and this calculator tells you which one you are choosing.
What does this calculator not account for?
- Taxes of any kind. Cash flow before tax is exactly that. Depreciation, the interest deduction and your marginal rate are not modelled, and after-tax leverage can differ from the pre-tax verdict here.
- Appreciation. The unlevered return reported is the cap rate, which is a current-income yield. Total return including value growth is not computed.
- Loan fees, points and closing costs. The constant is measured against the original loan amount, so origination costs are not in it. A loan with points has a higher effective constant than this figure.
- Capital expenditure and reserves. Net operating income is taken as you enter it. If your NOI does not carry a capital reserve, the cash flow shown is optimistic.
- Vacancy beyond whatever you already deducted in NOI.
- Any balloon. The constant is derived from the amortisation schedule and says nothing about when the loan matures.
- Interest-only periods. The comparison figure for an interest-only note is reported as the rate itself, but the payment and schedule are always computed as fully amortising.
- Variable rates. A fixed rate is assumed for the whole amortisation.
What mistakes do people make with this?
- Comparing the cap rate against the interest rate. This is the error the constant exists to prevent. At the defaults, 8.50% against 6.5% looks like 200 basis points of comfortable spread; against the 7.584816% constant it is 91.5 basis points, which is a much thinner deal.
- Treating the amortisation premium as a cost. The 1.084816 points, or $11,177.25 in year one, becomes equity. It reduces cash yield and increases net worth.
- Putting the mortgage payment into NOI. Net operating income is income after operating expenses and before debt service, always. Netting the payment into it makes the cap rate meaningless and the leverage test wrong.
- Measuring the constant against the current balance. It is defined against the original loan amount. Measuring it against a paid-down balance produces a number that rises every year and means nothing.
- Assuming shorter amortisation is safer. It raises the constant, cuts cash flow, and can flip leverage negative. It also raises your DSCR requirement pressure. At the defaults, moving to 15 years drops coverage from 1.6 to 1.16.
- Forgetting the constant sets the break-even. Any property yielding less than 7.584816% at these loan terms is one where borrowing reduces your return on equity.
Frequently Asked Questions
What is the difference between the loan constant and the interest rate?
What is positive leverage?
Why does an interest-only loan have a constant equal to its rate?
What cap rate do I need for this loan to make sense?
Does the loan constant change as I pay the loan down?
Why do commercial lenders quote a 25 or 30 year amortisation on a 10 year loan?
Sources
- Regulation Z (Truth in Lending), 12 CFR Part 1026, including the Appendix J annual percentage rate computation. ecfr.gov/current/title-12/chapter-X/part-1026
Also consulted: This calculation is pure loan mathematics and uses no statutory data. Every input on the page (loan amount, rate, amortisation term, property price and net operating income) is supplied by you; The payment comes from the standard annuity payment formula; the cap rate, debt service coverage and cash-on-cash return come from their conventional definitions: net operating income over price, net operating income over annual debt service, and cash flow before tax over equity invested; First-year principal is derived from the amortisation schedule identity, annual debt service less first-year interest, rather than re-derived from a balance, so it reconciles to the schedule.