Quick Answer: Alaska's cost of living is 26.6% above the U.S. national average (composite index 126.6), so a $75,000.00 national-average household budget costs about $94,950.00 a year in Alaska.
Where Alaska's 126.6 Comes From
The utilities index is the number to watch in Alaska: an index of 154.6 against the 100.0 national baseline, and the highest of the three sub-indices the state table publishes.
That sits behind a composite index of 126.6, putting Alaska 26.6% above the national average and 5th of 50 on cost. Groceries (index 134.2) and housing (index 123.5) are both above parity too, but neither reaches the utilities figure.
In dollar terms, entering the default $75,000 baseline returns $94,950.00, a differential of $19,950.00. The engine reaches that figure with one multiplication and nothing else, which is worth stating plainly before anything else on this page: it does not know your rent, your heating bill, or what share of your budget is food.
Key Index Components for Alaska:
- Composite Benchmark Index: 126.6 (Rank #5)
- Housing Cost Index: 123.5
- Utilities Cost Index: 154.6
- Grocery Cost Index: 134.2
How This Is Calculated
Alaska is the rare expensive state where housing is not the headline. Its housing index of 123.5 is the mildest of its three sub-indices, while utilities run 154.6 and groceries 134.2, both a long way past anything in the lower 48 outside Hawaii. The composite lands at 126.6, fifth-highest in the country, and the calculator applies that one number to whatever budget you enter.
- Baseline budget. You enter annual household spending priced at the national benchmark, index 100.0.
- Composite lookup. Alaska's composite index of 126.6 is read from the 2026 MERIC state table, along with its rank of #5 among the 50 states.
- Single-factor scaling. The baseline is multiplied by 126.6 and divided by 100. That is the entire calculation. Housing 123.5, groceries 134.2 and utilities 154.6 are not weighted, apportioned or blended into that figure by any code on this page. They are separate index ratios reported for context, and the sections below show exactly what the table does with them.
- Differential. The dollar difference and the percentage difference against the baseline are taken from the scaled result, and that percentage is fixed at 26.6% at every budget you can enter.
Worked Example
Using this calculator's baseline scenario: a household needing $75,000.00 a year to sustain a standard basket of goods, priced at the U.S. national average (composite index 100.0).
- National baseline. $75,000.00 is the reference spending level at the national-average price level (index 100.0).
- Apply Alaska's composite index. Alaska's composite index of 126.6 (rank #5 nationally) means local prices run 26.6% above the national basket. Scaling: $75,000.00 × (126.6 ÷ 100) = $94,950.00.
- Dollar differential. The engine returns a differential of +$19,950.00, so a household living in Alaska needs its budget to grow by that amount to hold the same basket.
- Percentage. That is +26.6% of the baseline, and it stays +26.6% whatever you enter.
No Bracket, No Cliff: What the Input Range Actually Does
There is no bracket, cliff, cap or phase-out anywhere in this calculator, and it is more useful to say so with figures than to imply an edge that does not exist. The sweep is a straight line through the origin:
- At the $10,000 floor the tool accepts, the adjusted figure is $12,660.00.
- At $50,000 it is $63,300.00.
- At $75,000 it is $94,950.00.
- At $120,000 it is $151,920.00.
- At the $200,000 upper sweep point it is $253,200.00, a differential of $53,200.00.
Across that entire twenty-fold range the percentage output never moves off 26.6% and the composite never moves off 126.6. The constant of proportionality is the index itself.
The marginal cost of the next thousand dollars. Enter $75,000 and the answer is $94,950.00. Enter $76,000 and it is $96,216.00. The step from $94,950.00 to $96,216.00 is what each additional $1,000 of national baseline budget costs in Alaska, and it is the same step at every point on the sweep, because nothing in the code varies with budget size.
Working the Calculation Backwards From $75,000 of Alaska Spending
The more actionable query is the inverse one. If you currently spend $75,000 a year at national-average prices and want the number that means the same standard of living in Alaska, you are not asking for $75,000 scaled down. You are asking which baseline the engine maps onto $75,000.
Running the calculator down to the dollar:
- At a baseline of $59,241, the adjusted Alaska figure is $74,999.11.
- At a baseline of $59,242, one dollar later, it is $75,000.37.
So $75,000 of Alaska spending corresponds to roughly $59,242 of national-baseline spending. Read the other way, which is how salary negotiations actually run: a household spending $75,000 at national prices needs $94,950.00 in Alaska, because that is what the forward run at $75,000 returns.
Why Subtracting 26.6% Gives the Wrong Answer
The common error is subtracting the percentage differential from the wrong base. Alaska is 26.6% above national, so it is tempting to reason that $75,000 of Alaska spending equals $75,000 minus 26.6%, or $55,050 of national baseline.
Run $55,050 through the engine and it returns $69,693.30, not $75,000. Percentage differentials are not symmetric: adding 26.6% and then removing 26.6% does not return you to the start. The verified pair is the one above, $59,242 in and $75,000.37 out, and it comes from running the calculator rather than from subtracting a percentage.
What the Multiplier Schedule Table Actually Shows
The 12-row table below the calculator has exactly one moving part, and here is its construction taken from the config rather than from the column headings.
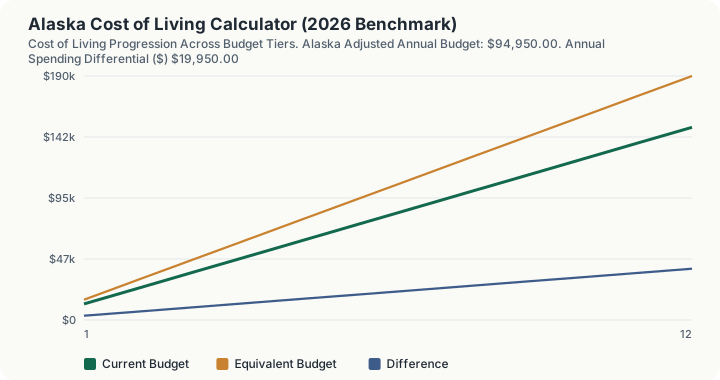
Each row i scales your baseline to budget × i ÷ 6 and prices it at the composite 126.6. The index is identical on every row. At the default $75,000 baseline the tiers rise in $12,500.00 steps: row 1 prices $12,500.00 and returns $15,825.00; row 2 prices $25,000.00 and returns $31,650.00; row 4 prices $50,000.00 and returns $63,300.00; row 6 prices the entered $75,000.00 and returns $94,950.00, which is the headline; row 12 prices $150,000.00 and returns $189,900.00.
Two consequences follow. Consecutive rows are directly comparable, because only the budget changes between them, and the equivalent-budget column climbs on every step from $15,825.00 to $189,900.00 without a single reversal. And the difference column is a fixed 26.6% of the row's tier throughout: $3,325.00 at row 1, $13,300.00 at row 4, $19,950.00 at row 6, $39,900.00 at row 12. The Alaska premium is proportional, so the table doubles cleanly and the ratio between any two rows is just the ratio of their budgets.
What the table is not is a category breakdown. Alaska's utilities index of 154.6, its grocery index of 134.2 and its housing index of 123.5 are published on this page because they explain why the composite lands where it does, particularly the unusual fact that heat and freight rather than shelter drive the Alaska premium. None of the three is ever multiplied by a budget here. The engine performs one multiplication, against the composite, and the sub-indices remain context.
What This Does Not Account For
- One composite index for the entire state. Anchorage, Juneau and a village off the road system all receive the identical 126.6 multiplier. There is no metro, borough or ZIP input.
- No category weighting of any kind. The engine does not know what share of your budget is housing or heat. It multiplies the whole budget by one factor.
- No taxes. State, local sales and property taxes are absent from this figure entirely. Alaska levies no state income tax, and that is not modelled here either, in either direction.
- No date and no inflation input. The 126.6 is a static table value. This config is not tax-year sensitive and has no year field, so nothing on this page ages the index forward.
- No Permanent Fund Dividend. The annual PFD payment is household income, not a price level, and no part of it enters this calculation.
Common Pitfalls
- Treating 126.6 as the number a renter faces. Utilities price at 154.6 and groceries at 134.2, both above the composite. A household heating a home through an Interior winter is exposed to the higher figures, and the engine will still return the composite result.
- Reversing the percentage instead of the index. $55,050 returns $69,693.30, not $75,000. Divide by the index; do not subtract the percentage.
- Reading a table row as a category budget. Row 4's $63,300.00 is the whole $50,000.00 tier priced at the 126.6 composite, not an Alaska utility bill and not an Alaska rent. The 154.6 utilities index and the 134.2 grocery index never enter that column.
- Expecting the percentage to change with budget size. It is 26.6% at $10,000 and 26.6% at $200,000.
Frequently Asked Questions
Is Alaska expensive to live in?
What is the biggest cost factor in Alaska?
How much salary do I need to maintain my lifestyle in Alaska?
Does the answer change at higher budgets?
Sources
- U.S. Bureau of Economic Analysis (BEA): Regional Price Parities. bea.gov/data/prices-inflation/regional-price-parities-state-and-metro-area
- U.S. Bureau of Labor Statistics (BLS): Consumer Expenditure Survey. bls.gov/cex
- Alaska Department of Revenue, the official state tax authority for Alaska rates, rules and forms. tax.alaska.gov
Also consulted: MERIC: Cost of Living Data Series (2025/2026), composite index 126.6, rank #5.