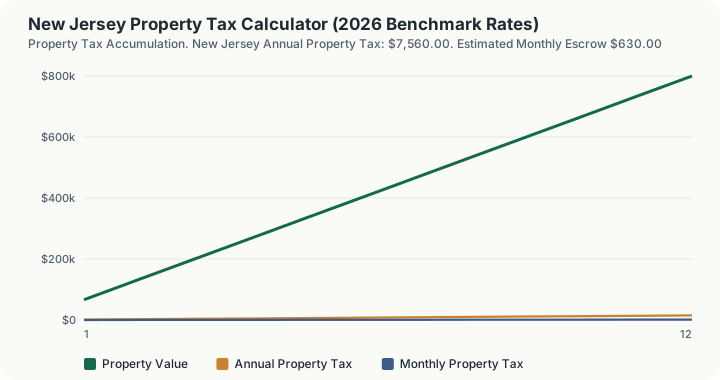
Quick Answer: A $400,000 home in New Jersey carries an estimated $7,560.00 in annual property tax at the state's 1.89% effective rate, or about $630.00 a month.
Second Highest Effective Rate, Priced Per Thousand
Ranked #2 out of 50 states, behind only Illinois, at an average effective rate of 1.89%, New Jersey lands among the ten highest effective property tax rates in the country. Measured against the roughly 1.0% average effective rate nationwide, New Jersey's number comes in well over one and a half times the national average of roughly 1.0%. Within the Northeast, where the average effective rate runs near 1.61%, New Jersey sits well above the regional norm.
As in most of the Northeast, property tax revenue in New Jersey funds local school districts, county services, and municipal budgets rather than flowing through a state-level general fund, so the rate is effectively set locally even though the average is reported statewide.
For anyone underwriting a purchase in New Jersey, this effective rate is the starting point for modeling PITI escrow and cash-on-cash returns. The worked example below walks through the full calculation on a sample home price so the math is transparent from assessed value to monthly payment.
How This Is Calculated
New Jersey assesses at the municipal level, with more than 500 separate taxing municipalities and no county assessment consolidation, which is a large part of why its effective rate of 1.89% ranks second in the country. Illinois is higher, at 1.92%. Relief comes through state programs paid after the fact rather than through exemptions on the bill.
None of that detail is asked for here. This calculator works one level up, applying New Jersey's average effective property tax rate of 1.89% to the value you enter. That rate is the ratio of property taxes actually paid to home value across the state, so the assessment ratios, caps, and exemptions described above are already baked into it.
What the calculator itself does is shorter than any of that, and it is worth being exact about, because this family of pages has previously described work the engine does not perform. There is no assessed-value conversion in the code, no millage lookup, and no reassessment logic of any kind:
- Read the value you entered in the market value field.
- Subtract the exemption you entered, and floor the result at zero. This is the only adjustment made to the base.
- Multiply by the single stored effective rate of 1.89%. One number, read from the state property tax table, applied once. There is no bracket, no class ratio and no local rate.
- Divide the annual figure by twelve for the escrow output, rounded to the cent.
- Build the twelve-row schedule by multiplying the value you entered by the row number and dividing by six, then applying the same 1.89% to each tier.
Worked Example
Using this calculator's baseline inputs: a $400,000 home in New Jersey, taxed at the state's 1.89% average effective rate (rank #2 of 50 states, behind only Illinois).
- Start with the assessed value. The home is assessed at its full $400,000.00 market value, with no homestead exemption applied in this baseline scenario.
- Apply the effective rate. $400,000.00 × 1.89% = $7,560.00 in annual property tax, New Jersey's statewide average effective rate.
- Convert to a monthly escrow. Lenders typically collect property tax in twelve equal installments alongside principal and interest: $7,560.00 ÷ 12 = $630.00 per month.
- Check the monthly and the per-thousand figures. The escrow output is $630.00 a month, and each additional $1,000 of market value adds $18.90 a year to the bill.
At 1.89%, New Jersey carries one of the heaviest property tax burdens in the country, ranking #2 of 50 states. That is a real cost to weigh against the purchase price.
Reading the Value Sweep Against the Exemption You Enter
The rate never changes, so the sweep is a straight line and every question about it has an arithmetic answer.
Each additional $1,000 of market value costs $18.90 a year. Raising the entry from $400,000 to $401,000 moves the annual tax from $7,560.00 to $7,578.90, and the same step applies at $100,000 or at $5,000,000. Per $10,000 of value the figure is $189.00.
The schedule row by row. Row 1 prices a $66,666.67 tier at $1,260.00 a year. Row 6 is your own entry, $400,000 at $7,560.00. Row 12 is $800,000 at $15,120.00, exactly twelve times row 1. The third column is the monthly figure for that row rather than a cumulative total, so nothing in this table accumulates.
The exemption walk. With no exemption the tax is $7,560.00 a year and $630.00 a month. Enter a $25,000 exemption and it becomes $7,087.50 and $590.63, a saving of $472.50 a year. Enter the field's $200,000 maximum against the $400,000 default and the tax falls to $3,780.00. The relationship is exactly linear, because the exemption comes off the base before the single rate is applied: every $1,000 of exemption is worth the same $18.90 that $1,000 of value costs.
Following the exemption down the column. The twelve-row schedule nets the exemption off each row's value before applying the 1.89% rate, exactly as the headline does. Enter $400,000 with a $25,000 exemption and the headline reads $7,087.50 against the $7,560.00 the page returns with the field at zero, a saving of $472.50 a year, and row 6 of the schedule reads $7,087.50 as well. Row 1 moves from $1,260.00 to $787.50 under the same entry. The two outputs answer the same question at the same exemption level, so the table can be read straight down against the result above it.
The reverse question: how much house before the annual bill reaches $5,000? At $264,550 of market value the tax reaches $5,000.00, or $416.67 a month. Nothing statutory happens at that point; it is simply where 1.89% of the value crosses the round number, and the escrow line crosses $416.67.
Right method against wrong method, priced. The input wants market value, because the stored 1.89% is an effective rate: taxes actually paid divided by home value across the state. If you instead enter the assessed or taxable figure printed on your notice, and that figure is a fraction of market value, the result is understated in the same proportion. Entering $100,000 where the market value is $400,000 returns $1,890.00 instead of $7,560.00, understating the annual bill by the difference. This is the single most common way to get a wrong answer out of this page, and no validation catches it because $100,000 is a perfectly plausible entry.
What This Does Not Account For
- The engine applies one statewide effective rate and nothing else. There is no county or municipal millage lookup, no assessment ratio, no classification, no cap or abatement logic, and no reassessment modelling anywhere in the code path. A single stored rate of 1.89% multiplies the value you enter.
- The exemption field is a flat dollar reduction of the base. It does not know which exemption you mean, tests no eligibility, and applies no per-programme cap beyond the field's own $200,000 maximum.
- The exemption field is a flat dollar subtraction with no eligibility test. Whatever you type is removed from the base before the 1.89% rate is applied, and the engine treats a general homestead, a senior freeze and a disabled-veteran exemption as the same number. A $25,000 entry returns $7,087.50 on a $400,000 home, $50,000 returns $6,615.00 and $100,000 returns $5,670.00; no step of that sweep asks whether the amount is one you actually qualify for, and no per-programme cap is enforced beyond the field's own maximum.
- Specific hyper-local county and municipal millage district variations within New Jersey.
- Municipality-by-municipality rate variation across New Jersey's 564 taxing jurisdictions. School, county, and municipal levies are set locally, not statewide, so two towns 10 minutes apart can carry effective rates a full percentage point or more apart from this 1.89% statewide average. Some municipalities also layer on separate fire district taxes not captured in a single town-wide millage figure.
- Commercial vs residential assessment classification differentials.
- Property tax appeal reductions or localized board of equalization adjustments.
Common Pitfalls
- Confusing Market Fair Value with Assessed Basis: Some jurisdictions assess property at fractional ratios rather than 100% of market value.
- Failing to File Homestead Paperwork: Homestead exemptions are rarely automatic; homeowners must file timely paperwork with the county appraisal district.
- Underestimating Post-Sale Supplemental Assessments: Purchasing a newly constructed or reassessed property often triggers catch-up supplemental tax bills.
- Ignoring Property Tax Appeal Windows: Missing the annual 30-to-60 day statutory protest window forfeits the right to challenge over-assessed property values for that tax year.
Frequently Asked Questions
How high are property taxes in New Jersey?
When are property taxes due in New Jersey?
How can I lower my property taxes in New Jersey?
Does purchasing a home trigger a property tax reassessment?
Does the federal SALT deduction cap matter more in New Jersey than in other states?
Sources
- U.S. Census Bureau: American Community Survey (ACS) Real Estate Assessment Benchmark Data. census.gov/programs-surveys/acs
- New Jersey Division of Taxation: Property Tax Assessment Guidance. nj.gov/treasury/taxation