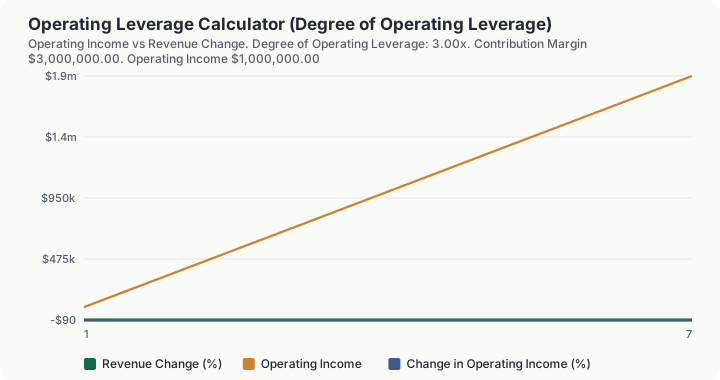
Quick Answer: A business with $5,000,000 of revenue, variable costs at 40% of revenue and $2,000,000 of fixed costs has a contribution margin of $3,000,000 and operating income of $1,000,000, giving a degree of operating leverage of 3.00x. A 10% revenue change becomes a 30% change in operating income, in both directions. Break-even revenue is $3,333,333.33, so the margin of safety is 33.33%: exactly the reciprocal of the DOL.
What does this calculator do?
Operating leverage is the mechanism that turns a modest revenue move into a dramatic profit move. It exists entirely because of fixed costs.
If every cost scaled with volume, a 10% revenue increase would produce a 10% profit increase and nothing more. But fixed costs do not move. Once they are covered, every additional dollar of contribution margin drops straight to operating income, which means profit grows faster than revenue. The same arithmetic runs in reverse on the way down, and with exactly the same multiplier.
The degree of operating leverage measures that amplification:
DOL = (Contribution Margin)/(Operating Income)
It is an elasticity: a 1% revenue change moves operating income by DOL percent, precisely, as long as the variable cost ratio and the fixed cost base are unchanged.
Two facts make the number more useful than it first appears. First, DOL is not a fixed property of a business: it depends on where you are relative to break-even, and it rises without limit as you approach it. Second, DOL is exactly the reciprocal of the margin of safety. A business operating 33.33% above break-even has a DOL of 3.00x, necessarily. Those are two ways of stating the same fact, and either one tells you the other.
A software business with heavy engineering costs and near-zero marginal cost has high operating leverage: brutal below scale, extraordinary above it. A distributor with thin fixed costs has a DOL close to 1.00x and its profit simply tracks revenue.
How is this calculated?
CM = R − (R × v); OI = CM − F; DOL = CM/OI
R_BE = F/(1 − v); MoS% = (R − R_BE)/R × 100
Step 1: Compute the variable costs. Revenue multiplied by the variable cost ratio.
Step 2: Compute the contribution margin. Revenue less variable costs. This is the pool that must cover fixed costs before any profit exists.
Step 3: Compute the contribution margin ratio. One minus the variable cost ratio, expressed as a percentage. It is derived from the ratio directly rather than from the dollar figures.
Step 4: Compute operating income. Contribution margin less fixed costs.
Step 5: Compute the degree of operating leverage. Contribution margin divided by operating income. When operating income is exactly zero the calculator returns "Undefined at break-even" rather than dividing by zero.
Step 6: Compute the operating margin. Operating income divided by revenue, as a percentage.
Step 7: Compute break-even revenue. Fixed costs divided by the contribution margin ratio. This is null when the contribution margin ratio is zero or negative, since no volume then covers the fixed base.
Step 8: Compute the margin of safety. Revenue less break-even revenue, divided by revenue, as a percentage. How far revenue can fall before operating income reaches zero.
Step 9: Apply the revenue shock. Revenue multiplied by one plus the shock. Shocked operating income is that shocked revenue multiplied by the contribution margin ratio, less the unchanged fixed costs. Fixed costs do not move with the shock, which is the entire source of the amplification.
Step 10: Compute the change in operating income. Shocked operating income less original operating income, divided by the absolute value of the original, as a percentage.
Step 11: Build the scenario table. The same computation is repeated at seven revenue shocks from −30% to +30% in 10-point steps.
Worked Example
Defaults: $5,000,000 revenue, variable costs at 40% of revenue, $2,000,000 of fixed costs, a +10% revenue shock.
Step 1: Compute the variable costs. $5,000,000 × 40% = $2,000,000
Step 2: Compute the contribution margin. $5,000,000 − $2,000,000 = $3,000,000
Step 3: Express it as a ratio. 100% − 40% = 60% contribution margin ratio
Step 4: Compute operating income. $3,000,000 − $2,000,000 = $1,000,000
Step 5: Compute the operating margin. $1,000,000 ÷ $5,000,000 = 20.00%
Step 6: Compute the degree of operating leverage. $3,000,000 ÷ $1,000,000 = 3.00x
Step 7: Apply the +10% revenue shock. $5,000,000 × 1.10 = $5,500,000
Step 8: Compute the shocked operating income. ($5,500,000 × 60%) − $2,000,000 = $3,300,000 − $2,000,000 = $1,300,000
Step 9: Compute the change in operating income. ($1,300,000 − $1,000,000) ÷ $1,000,000 = +30.00%
Exactly 3.00 times the 10% revenue change, as the DOL predicted.
Step 10: Compute break-even revenue. $2,000,000 ÷ 60% = $3,333,333.33
Step 11: Compute the margin of safety. ($5,000,000 − $3,333,333.33) ÷ $5,000,000 = 33.33%
Step 12: Confirm the reciprocal relationship. 1 ÷ 33.33% = 3.00, the DOL again
Now run it downward. A −20% shock takes revenue to $4,000,000, contribution margin to $2,400,000 and operating income to $400,000: a 60% fall from $1,000,000. Leverage is symmetrical: the same multiplier that made a good year look excellent makes a mediocre year look like a crisis.
Raise fixed costs to $2,700,000 on the same revenue and operating income falls to $300,000, pushing DOL to 10.00x. The same 10% revenue move would then swing operating income by 100%. Nothing about the product changed; only the cost structure did.
What does this calculator not account for?
- Fixed costs are fixed within the period only. In reality they are step functions: another facility, another engineering team, another shift. The model holds them constant at every revenue level in the scenario table, including at +30%, where a real business would probably have added capacity.
- The variable cost ratio is constant. No volume discounts on inputs, no price changes, no mix shift between products with different margins.
- Revenue changes are volume changes only. A price-driven revenue increase carries no additional variable cost and produces even more amplification than this model shows; a volume-driven one is what is modelled.
- No financial leverage. Interest expense and the degree of financial leverage sit below operating income and are not included. Total leverage is the product of the two, and only the operating half is computed here.
- No taxes. Everything is pre-tax operating income.
- A single period. There is no working capital effect, no cash conversion timing and no capacity constraint.
- DOL is a point measure. It is valid at the current revenue level, and it changes as revenue moves. The 3.00x reported here is not a property that survives a large revenue change: at $5,500,000 of revenue the DOL is already 2.54x.
- Undefined at break-even. When operating income is exactly zero the DOL and the percentage change are undefined and the calculator reports that rather than a number.
- Every input is yours. There is no source, benchmark or industry data embedded in this page.
What mistakes do people make with this?
Treating DOL as a permanent characteristic. It is a snapshot at your current revenue. As revenue rises above break-even, DOL falls toward 1.00x; as revenue approaches break-even it rises without limit. A business quoted as "a 5x operating leverage business" is being described at one point on a curve.
Forgetting the downside. The amplification is symmetrical. The 3.00x that turns a 10% revenue gain into a 30% profit gain turns a 20% revenue fall into a 60% profit collapse. High operating leverage is not a quality signal, it is a risk profile.
Misclassifying costs. Everything that is not genuinely volume-driven is fixed for this purpose. Salaries are fixed; hosting that scales per user is variable; a minimum committed cloud spend with usage above it is both. Getting the split wrong moves DOL more than any other input.
Reading a high DOL near break-even as good news. As operating income approaches zero the ratio explodes toward infinity. A DOL of 40x means the business is barely profitable, not that it is a powerful compounder.
Confusing operating leverage with financial leverage. Operating leverage comes from fixed operating costs; financial leverage comes from fixed interest costs. They multiply together, and a business with both is far more exposed than either figure alone suggests.
Ignoring the margin of safety. It is the same information as DOL in a more intuitive unit. If a 33.33% revenue fall would wipe out operating income entirely, that is usually the more useful sentence to put in front of a board than "our DOL is 3.00x".
Frequently Asked Questions
What is a good degree of operating leverage?
How is DOL related to the margin of safety?
Why is my DOL undefined?
Does operating leverage work the same way on the downside?
What counts as a fixed cost for this calculation?
Can a business have a DOL below 1.00x?
Sources
- U.S. Securities and Exchange Commission, Investor.gov, the official authority for the investing this calculator relates to. investor.gov
Also consulted: Contribution margin: revenue less variable costs; Operating income: contribution margin less fixed costs; Degree of operating leverage: contribution margin divided by operating income, undefined at zero operating income; Break-even revenue: fixed costs divided by the contribution margin ratio; Margin of safety: (revenue − break-even revenue) / revenue, the reciprocal of DOL; Revenue, the variable cost ratio, fixed costs and the revenue shock are all user inputs with no authoritative source. The defaults are illustrative only.
This page contains no statutory or published data. Operating leverage is a managerial-accounting definition, implemented in engine/primitives/operating-leverage.ts.