Quick Answer: The PEG ratio adjusts the P/E ratio for expected earnings growth, calculated as P/E Ratio divided by Annual EPS Growth Rate, with a reading near 1.0 generally considered fair value and below 1.0 considered potentially undervalued.
Overview
The Price/Earnings to Growth ratio, or PEG ratio, was popularized by investor Peter Lynch as a fix for the biggest blind spot in the plain P/E ratio: P/E alone treats a stock growing earnings 5% a year the same as one growing 40% a year, as long as both trade at the same multiple. That comparison is not fair. A fast grower's earnings will be meaningfully larger a few years out, so paying a higher multiple for it today can still be reasonable, while paying that same multiple for a slow grower is a much weaker deal. PEG divides the P/E ratio by the expected annual earnings growth rate, producing a single number that lets you compare a rapidly growing company against a mature, slow-growing one on more equal footing.
Lynch's original rule of thumb, popularized in his book One Up on Wall Street, was that a PEG ratio near 1.0 represents fair value: the market is pricing the stock's earnings multiple exactly in line with its growth rate. A PEG comfortably below 1.0 suggests the stock may be undervalued relative to how fast its earnings are expected to grow, while a PEG well above 1.0 suggests the market may be paying too much for that growth, or pricing in optimism that has already been fully captured. This is a heuristic, not a strict valuation model, but it remains one of the most widely cited shorthand metrics in growth-stock investing precisely because it is easy to compute and easy to compare across companies.
Because the growth rate input is a forward-looking projection, typically an analyst consensus estimate for the next three to five years, the PEG ratio is only as reliable as that growth estimate. Two analysts covering the same stock can produce meaningfully different PEG ratios simply by using different growth assumptions, which is worth remembering whenever comparing PEG figures pulled from different sources.
How This Is Calculated
The calculation happens in two stages. First, the P/E ratio:
Then, the PEG ratio divides that P/E by the expected annual EPS growth rate, expressed as a plain percentage number rather than a decimal fraction:
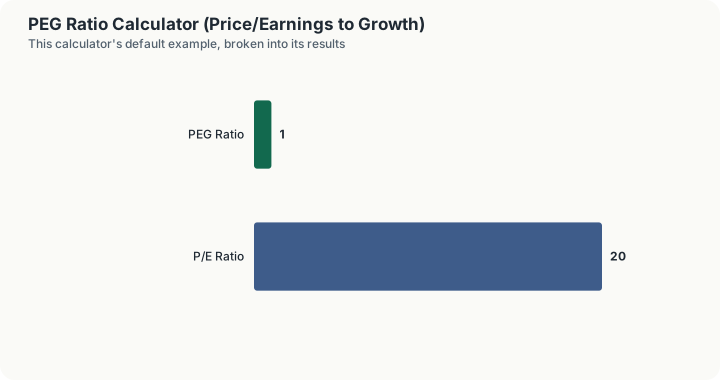
Under this convention, a P/E of 20 paired with a 20% expected growth rate produces a PEG of exactly 1.0, which is the standard convention used by Peter Lynch and most financial data providers: the growth rate enters the formula as the number 20, not as 0.20. The calculator first computes the P/E ratio from share price and EPS, then divides that result by the growth rate input to arrive at the PEG. All arithmetic runs on arbitrary-precision Decimal values to avoid binary floating-point rounding drift across the two chained divisions.
Worked Example
Consider a company with the following figures:
- Current Share Price: $180.00
- Trailing Twelve-Month EPS: $9.00
- Expected Annual EPS Growth Rate: 20% (a 3-5 year forward analyst consensus estimate)
Step 1: P/E ratio.
Step 2: PEG ratio.
A PEG ratio of exactly 1.0 sits right at Peter Lynch's fair-value benchmark: the market is paying a multiple of earnings that lines up proportionally with the company's expected growth rate. If the same company's growth estimate rose to 40% with the price and EPS unchanged, the PEG would fall to 0.5, a reading that would typically be flagged as attractively valued relative to growth. If the growth estimate instead fell to 8%, the PEG would rise to 2.5, a reading that would typically be flagged as expensive relative to growth.
What This Does Not Account For
PEG is a useful shorthand, not a complete valuation framework, and it carries several real limitations. It treats all growth as equally valuable and equally certain, when in practice growth from a durable, high-margin business is worth more than growth from a low-margin, capital-intensive one, and growth projections themselves carry meaningfully different confidence levels across companies and analysts. It becomes unreliable or meaningless for companies with very low, negative, or highly volatile growth rates, since dividing by a small or negative number produces extreme or nonsensical results. It ignores dividends entirely, understating the total return case for mature, slower-growing companies that return significant capital to shareholders through dividends rather than reinvesting for growth. It does not adjust for differences in risk, debt levels, or capital structure between companies being compared. It also inherits every weakness of the underlying P/E ratio, including sensitivity to one-time accounting items in the EPS figure.
Common Pitfalls
- Using inconsistent growth rate horizons across comparisons. A 1-year growth estimate and a 5-year growth estimate can produce very different PEG ratios for the same company; confirm the timeframe before comparing PEG figures across sources.
- Applying PEG to cyclical or low-growth companies. A utility or mature industrial with 2-3% expected growth will show an artificially inflated PEG even at a modest P/E, since the growth denominator is small.
- Treating "PEG near 1.0" as a hard buy signal. Lynch's benchmark is a rule of thumb from a specific market era and investing style, not a universal law; sector norms and interest rate environments shift what a "fair" PEG looks like over time.
- Mixing GAAP and non-GAAP growth estimates. A growth rate based on adjusted, non-GAAP earnings can differ meaningfully from one based on reported GAAP earnings, skewing comparisons.
- Ignoring the reliability of the growth estimate itself. A PEG built on an overly optimistic analyst projection will look artificially cheap right up until the growth fails to materialize and the estimate gets revised down.
Frequently Asked Questions
What is considered a "good" PEG ratio?
Why does the growth rate use whole percentage numbers instead of decimals?
Can the PEG ratio be negative?
Should I use trailing or forward growth estimates?
How is PEG different from just comparing P/E ratios directly?
Sources
- CFA Institute. Equity Valuation: Applications and Processes, CFA Program Curriculum. cfainstitute.org
- U.S. Securities and Exchange Commission. Regulation S-K, Item 601 (Earnings Per Share disclosure requirements). sec.gov
- U.S. Securities and Exchange Commission, Investor.gov, the official authority for the investing this calculator relates to. investor.gov
Also consulted: Lynch, Peter, with John Rothchild. One Up on Wall Street. Simon & Schuster, 1989; Financial Accounting Standards Board (FASB). ASC 260, Earnings Per Share.